OpenCost Configuration
Configure cost visibility with OpenCost on Plural
What You'll Get
Plural's leverages OpenCost to gather cost data for any deployed cluster. This works by:
- deploying an opencost instance per cluster, which acts as a lightweight agent exposing no web ui.
- configuring an extractor to periodically scrape that instance and ship the data to our central store for historical retrieval and analysis.
This provides a seamless multi-cluster experience for opencost data, and when combined with Plural's built-in deployment knowledge and AI capabilities, can also automate the remediation of overprovisioning with our PR generation capabilities.
- Displaying saturation data for common compute controllers within Kubernetes, like deployments and statefulsets
- Displaying cluster-level aggregate metrics for CPU, memory, pod saturation, etc.
- Extracting network metrics for service mesh observability, in particular Istio and Cilium both have their standard network metrics shipped to Prometheus. We can use them to provide a holistic network graph and also use that information to inform Plural AI.
Once configured, if you go to a compute-related resource and click on the Metrics tab, you'll see:
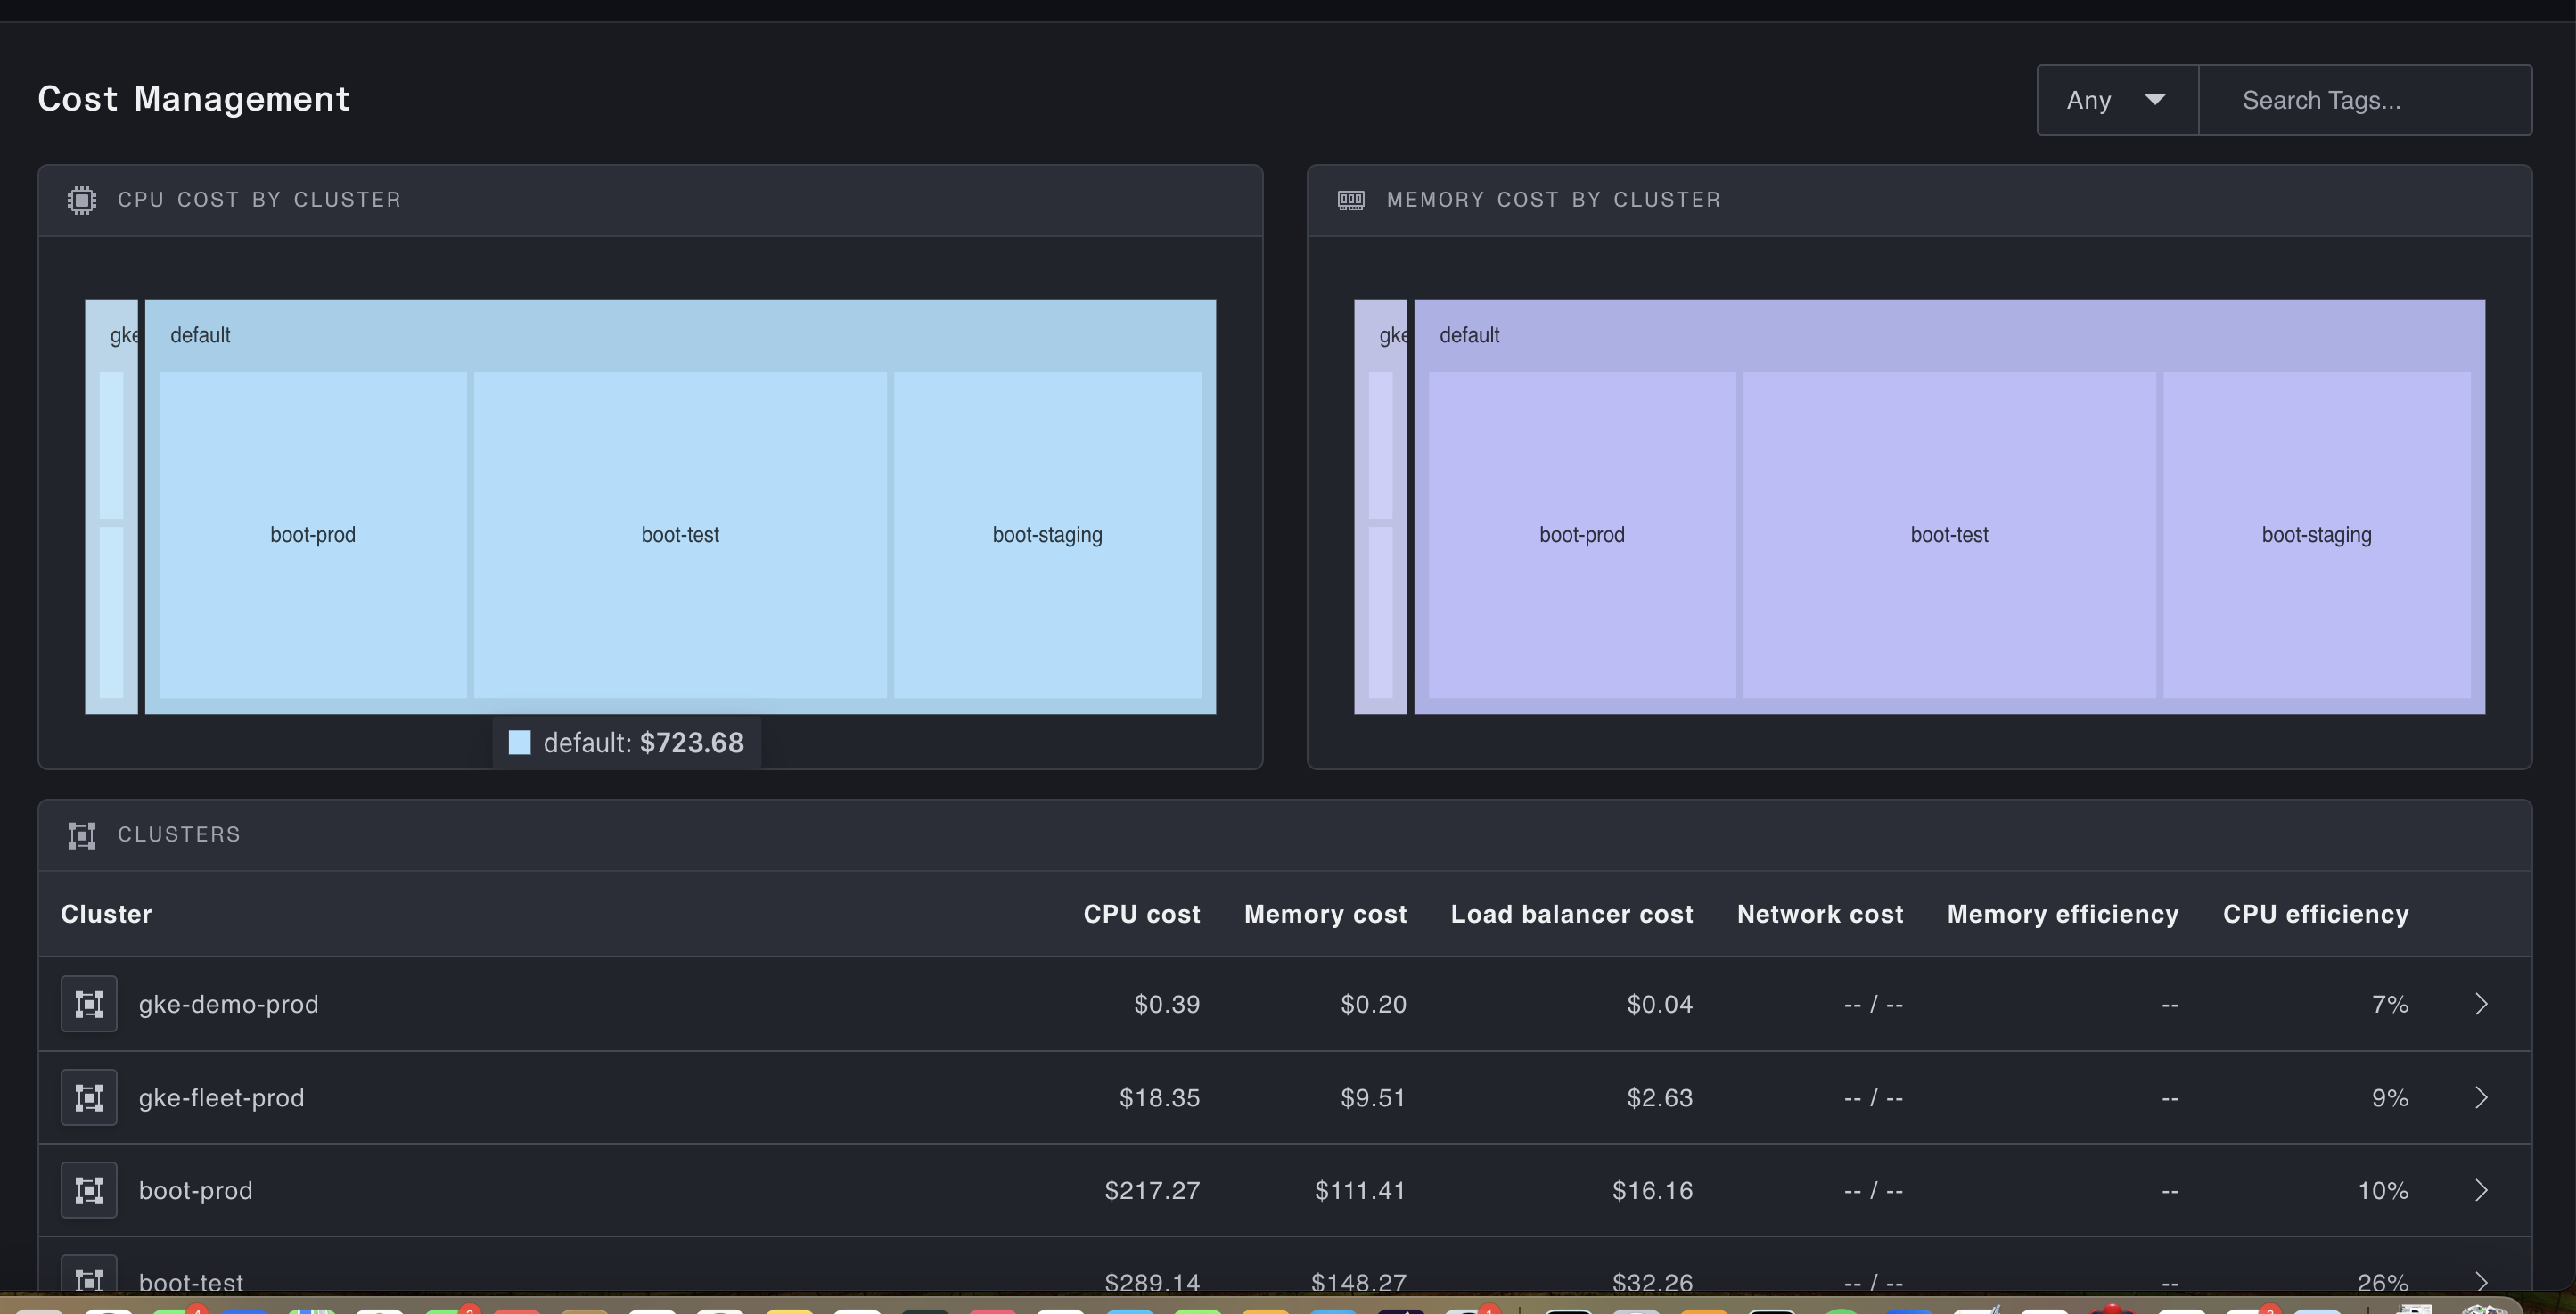
A Full fleet-wide dashboard for cost information:
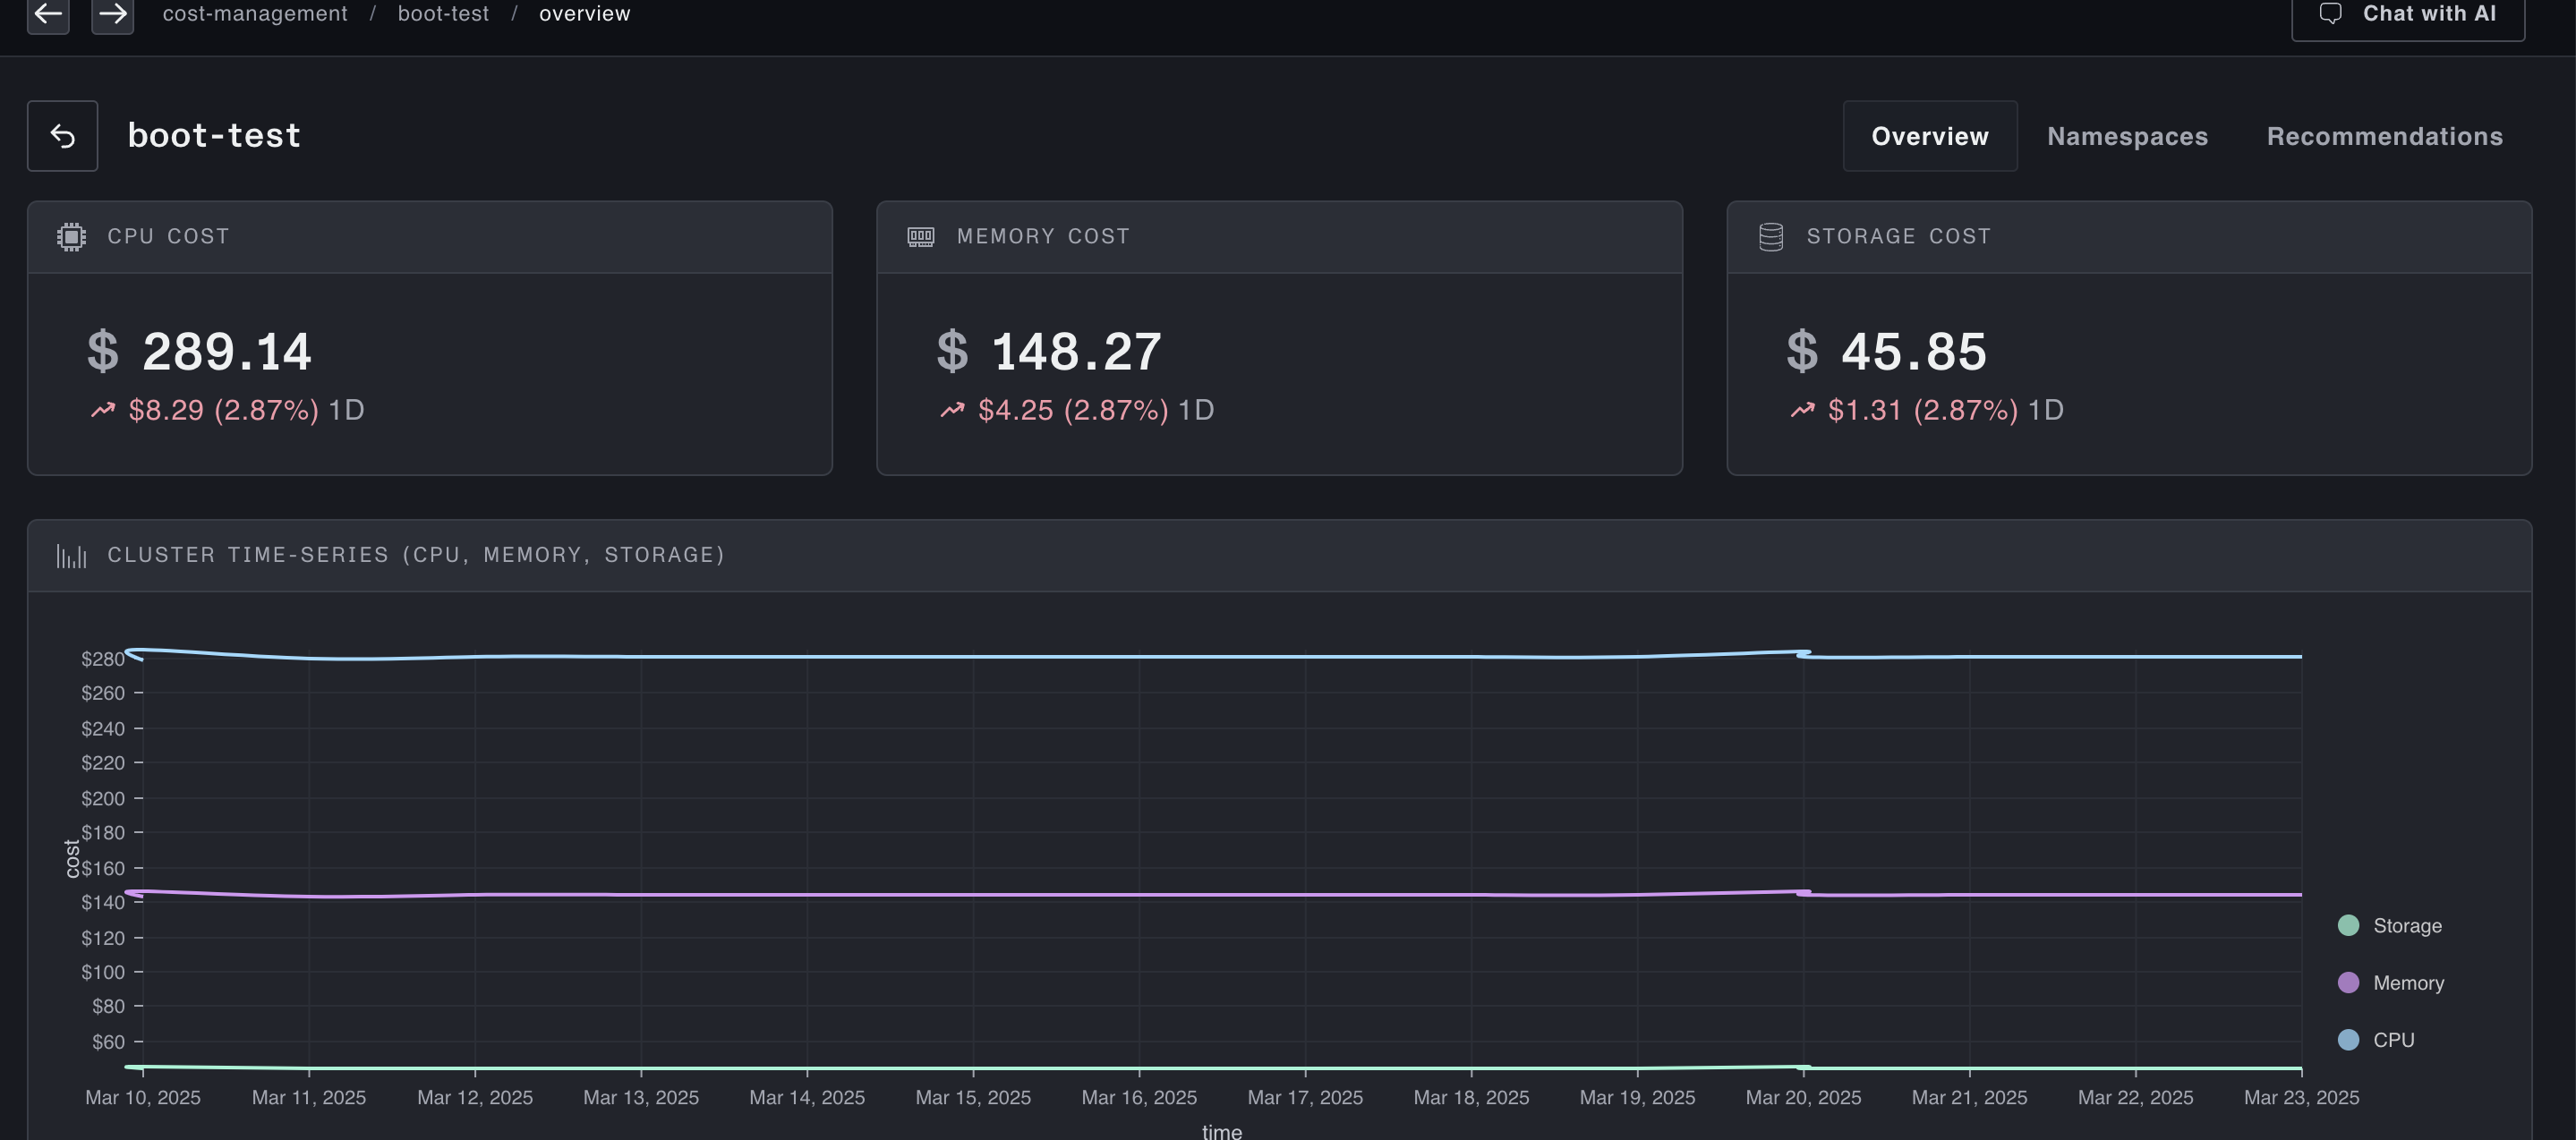
A dashboard for a specific cluster: