ElasticSearch Configuration
Configure multi-cluster Log Aggregation with Plural
What You'll Get
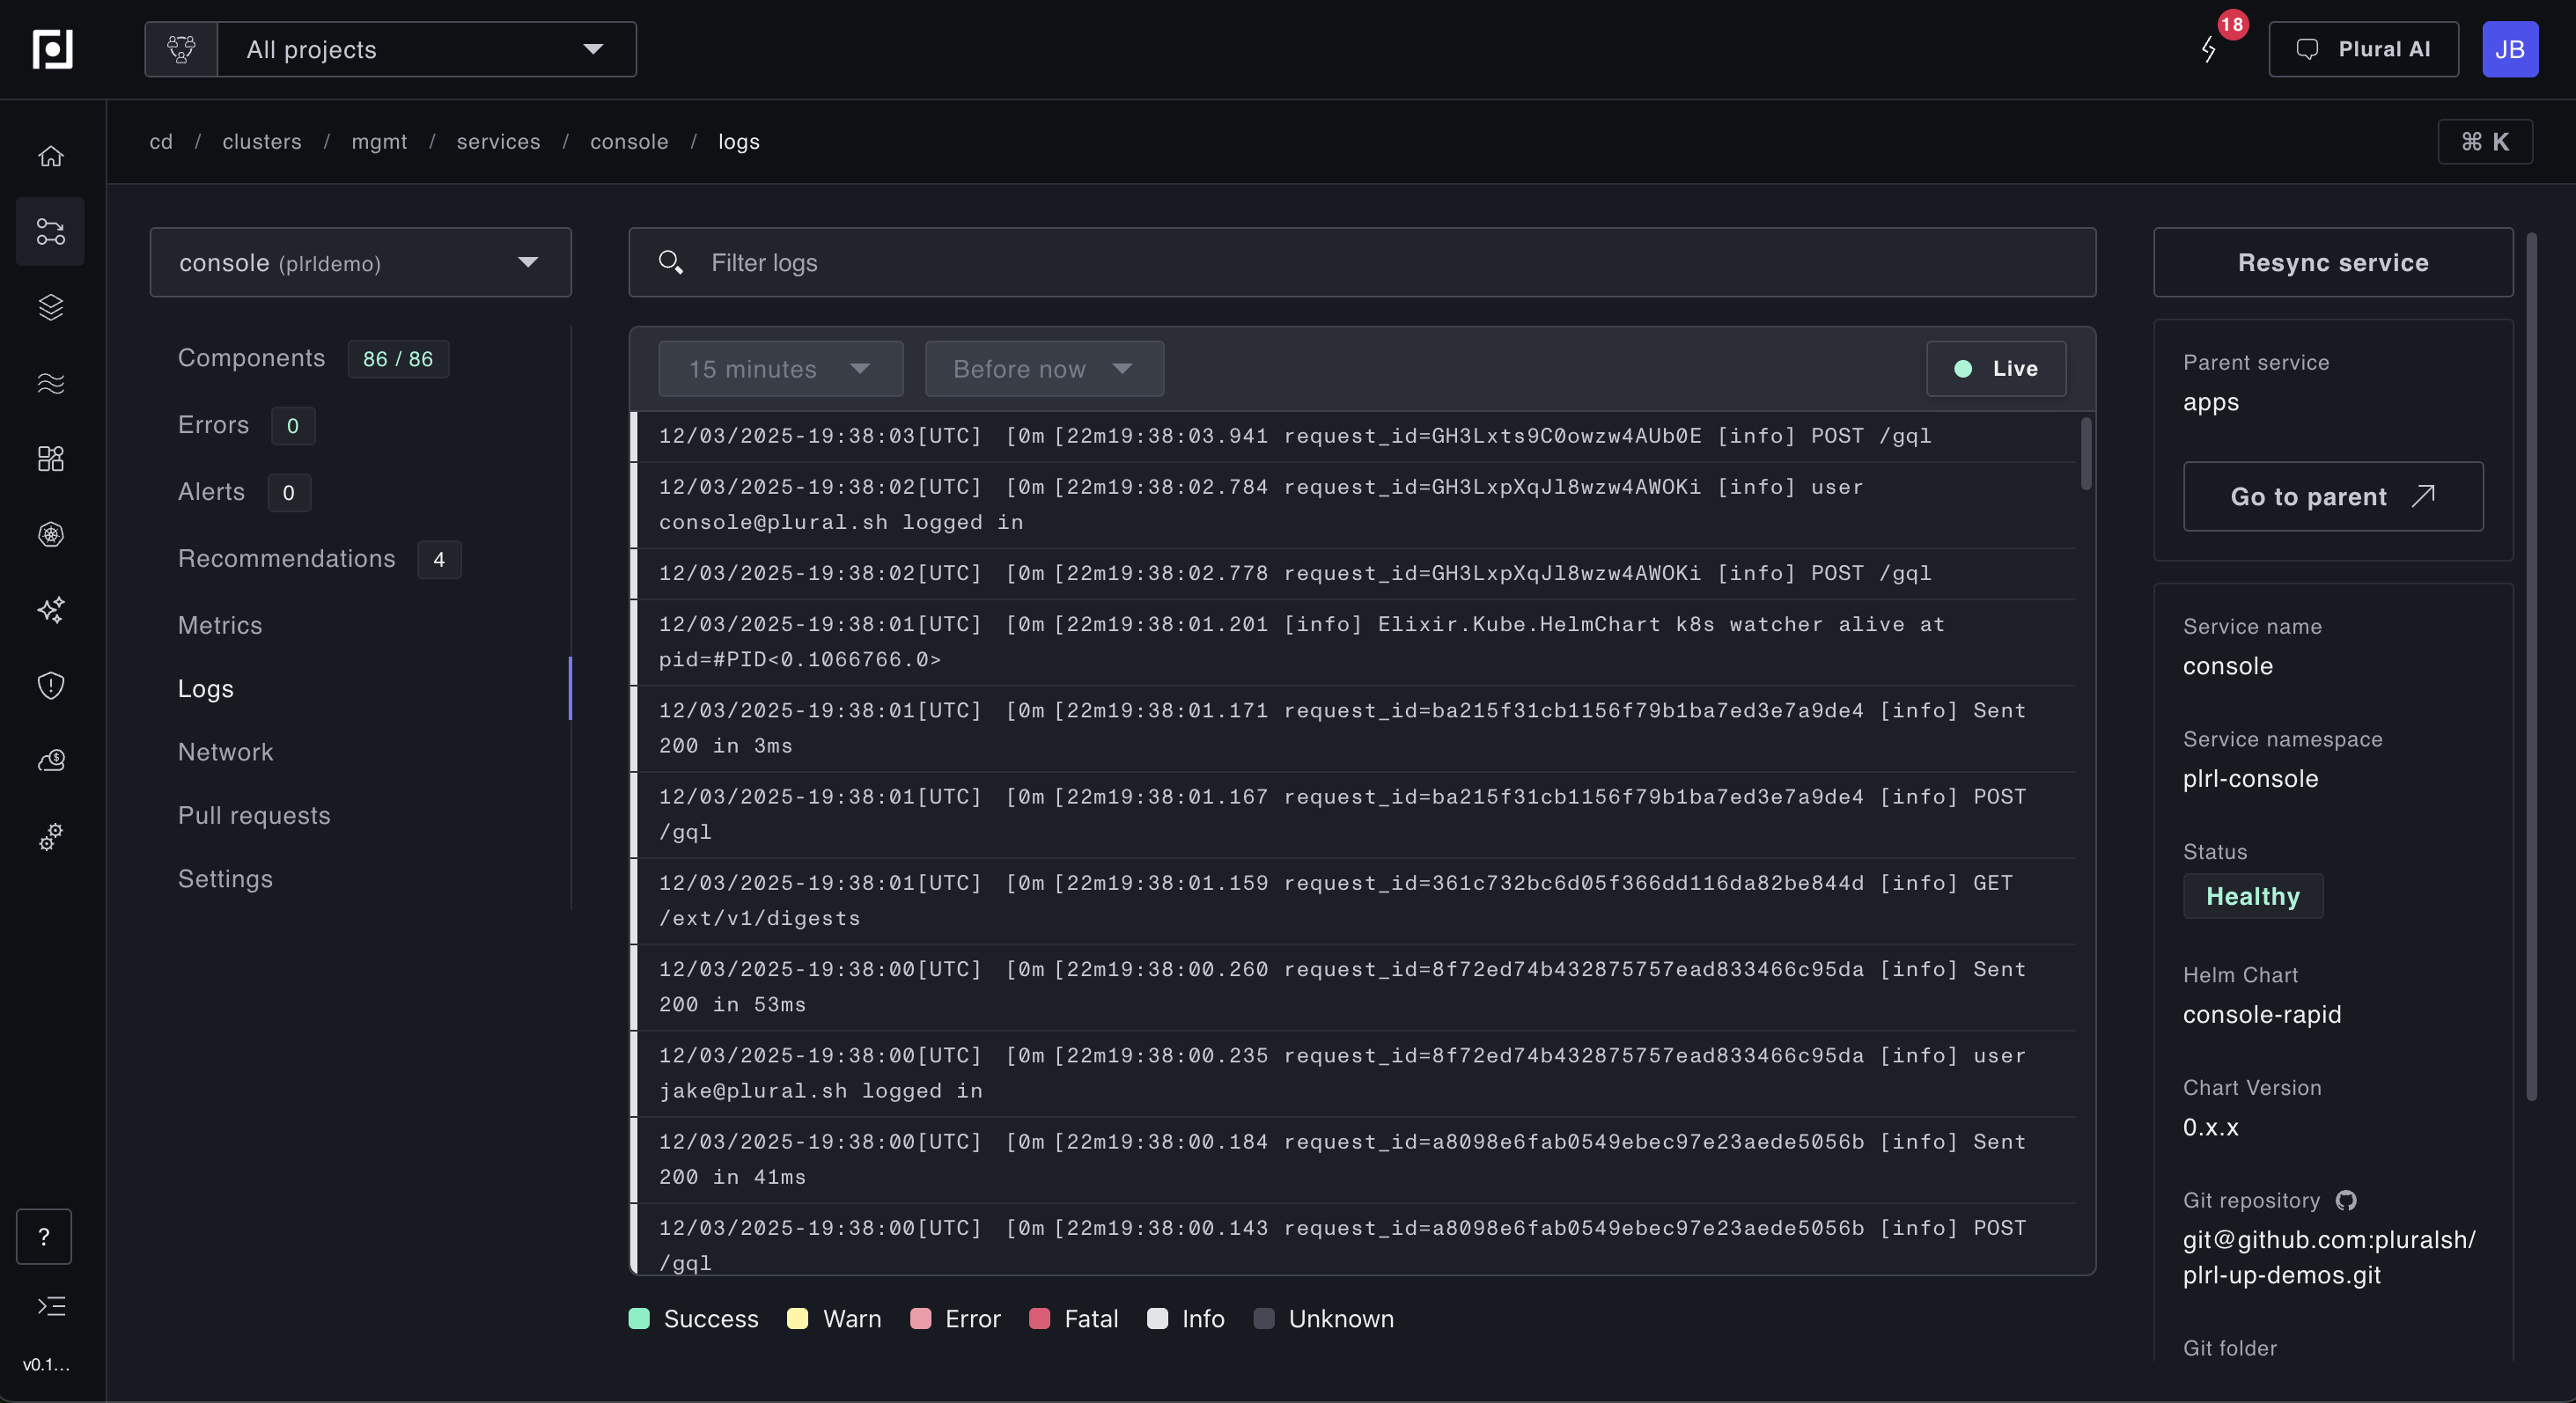
Plural's built-in log support allows you to query logs at either the Service or Cluster level, depending on your permissions to those respective resources. Service logs are relevant for developer personas, whereas cluster logs are typically useful for platform engineers and Kubernetes admins.
The Logs tab includes standard features like text-based search, facet filtering, and time filtering:
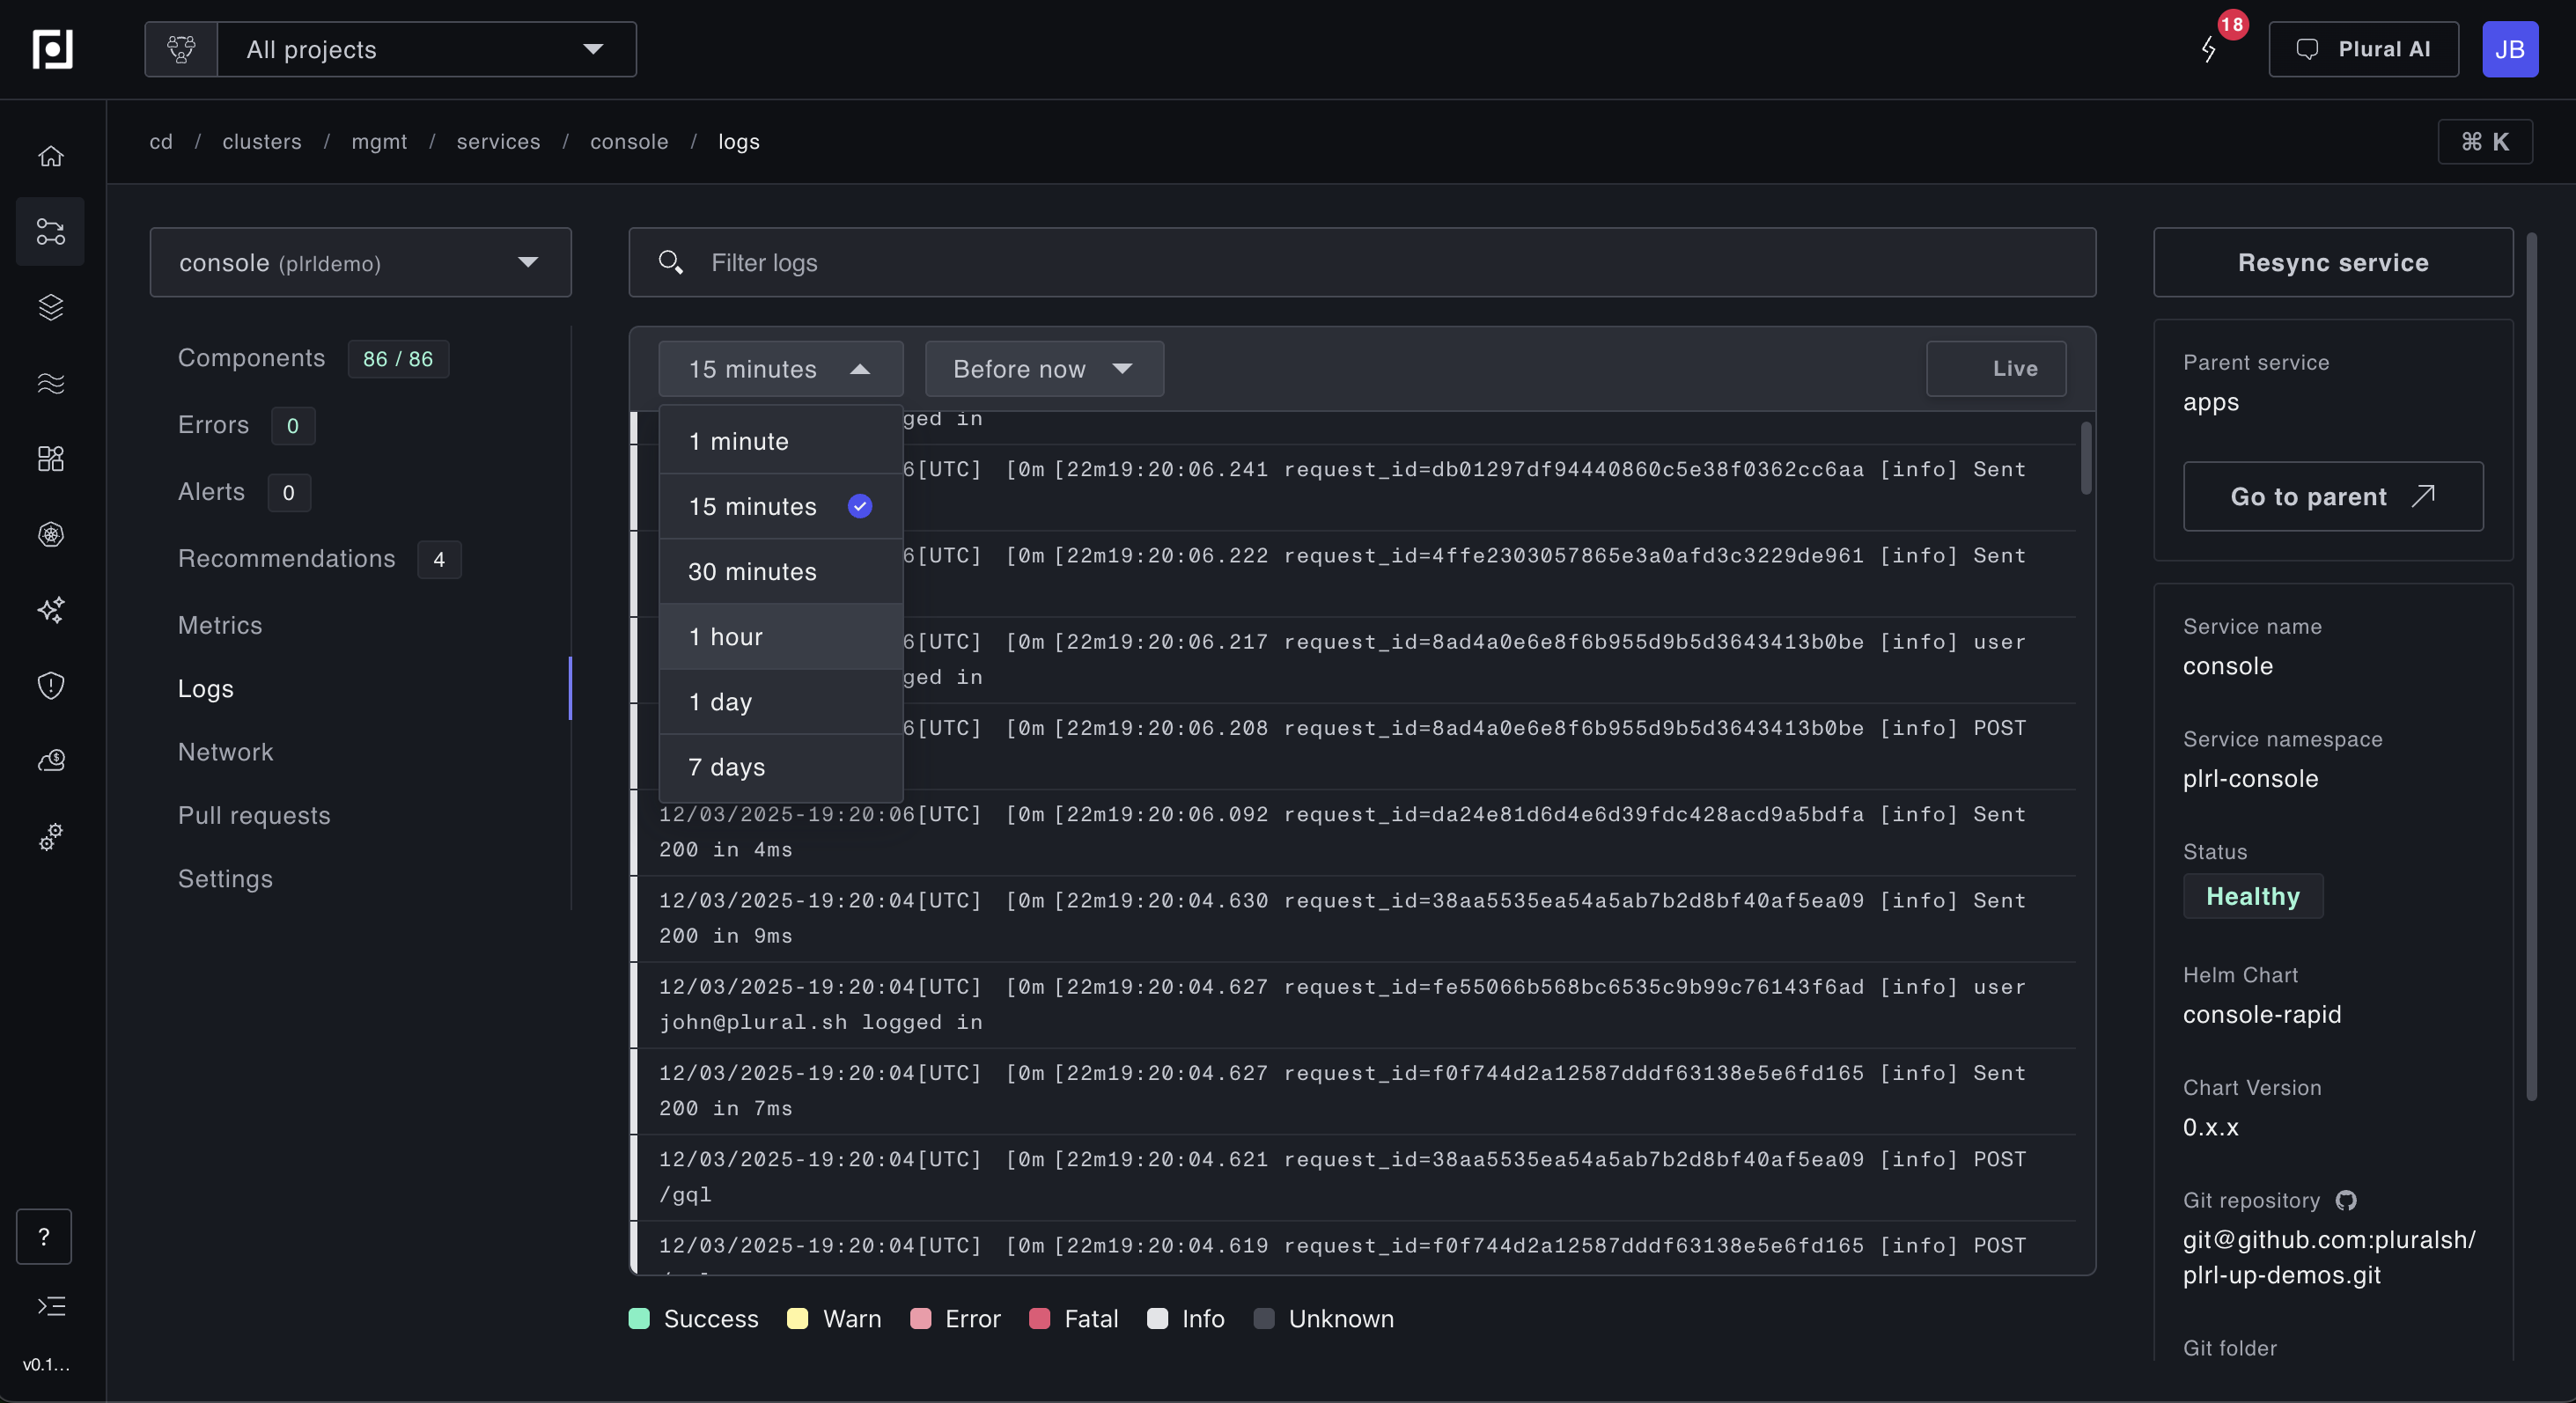
By default, live logs refresh every 10 seconds, which is ideal for monitoring deployments or watching for real-time issues. To view historical logs, simply scroll down. The view displays logs from the last 15 minutes by default. To adjust the lookback window (for example, when investigating an incident from an hour ago), use the time window modal:
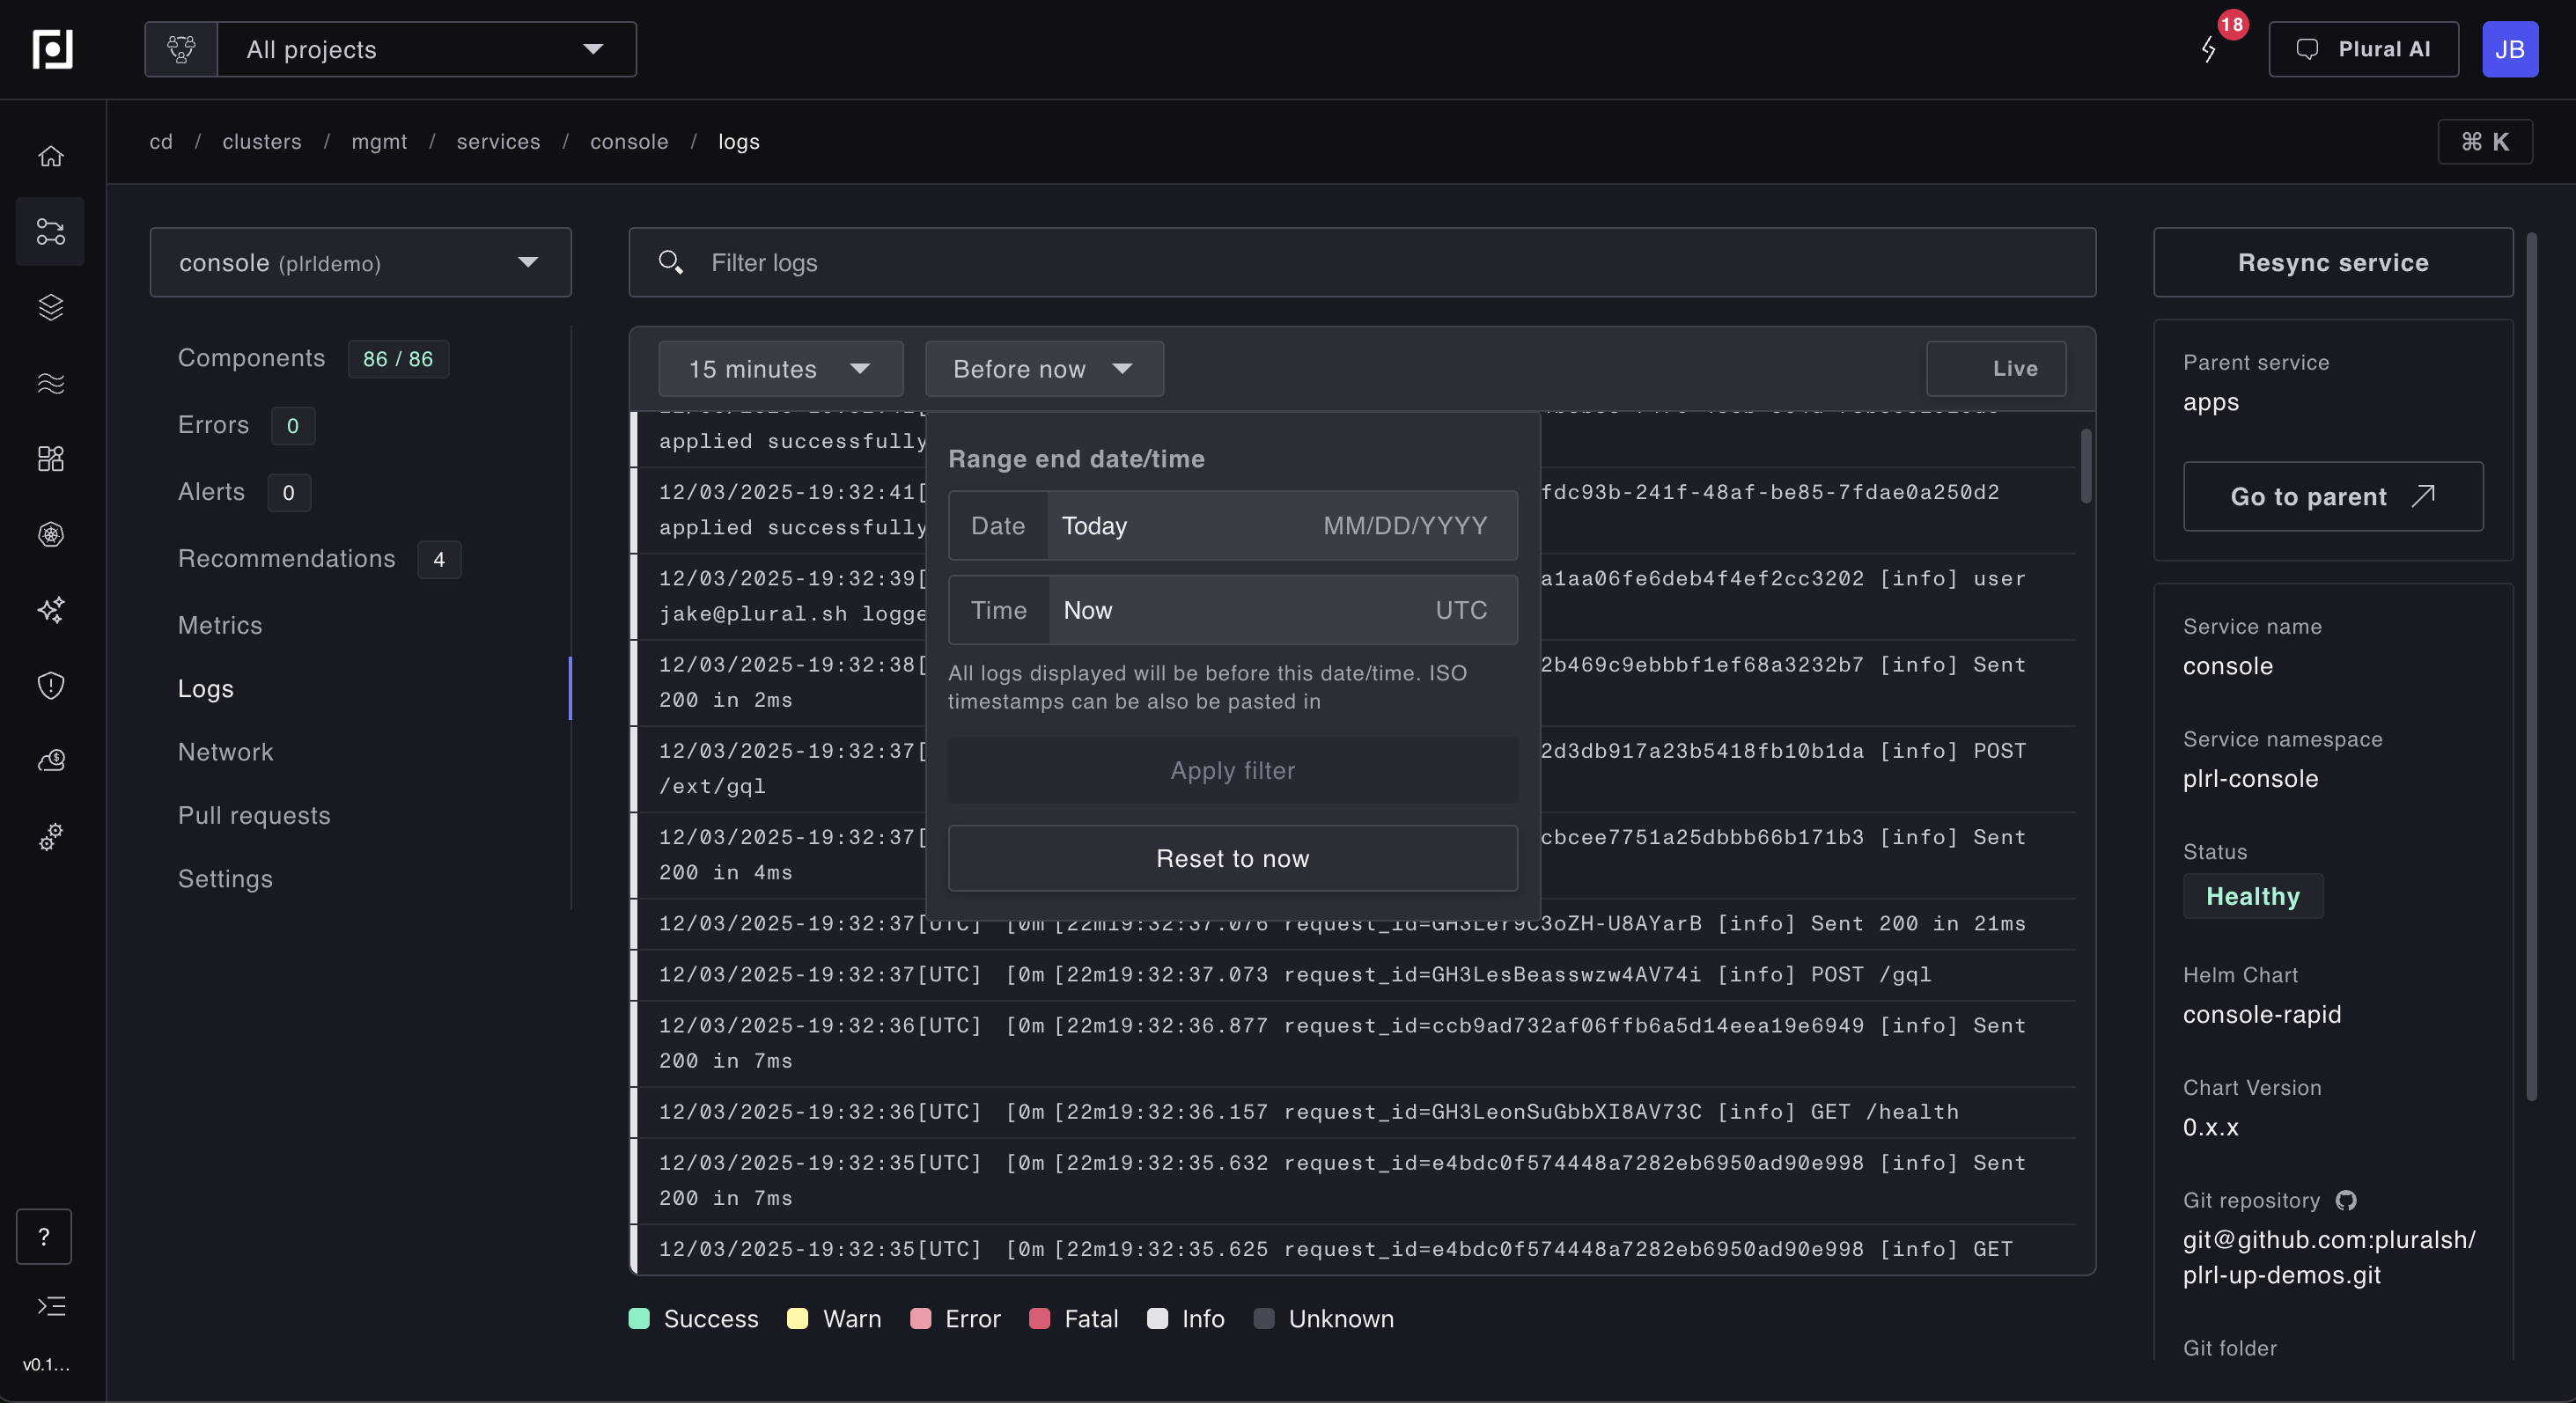
By default, logs are shown up to the current time, and you can adjust this via the datetime modal to investigate historical issues. This is particularly useful when you need to correlate logs with a specific incident time. Note: the default log retention is 7 days, so logs older than that are not queryable.
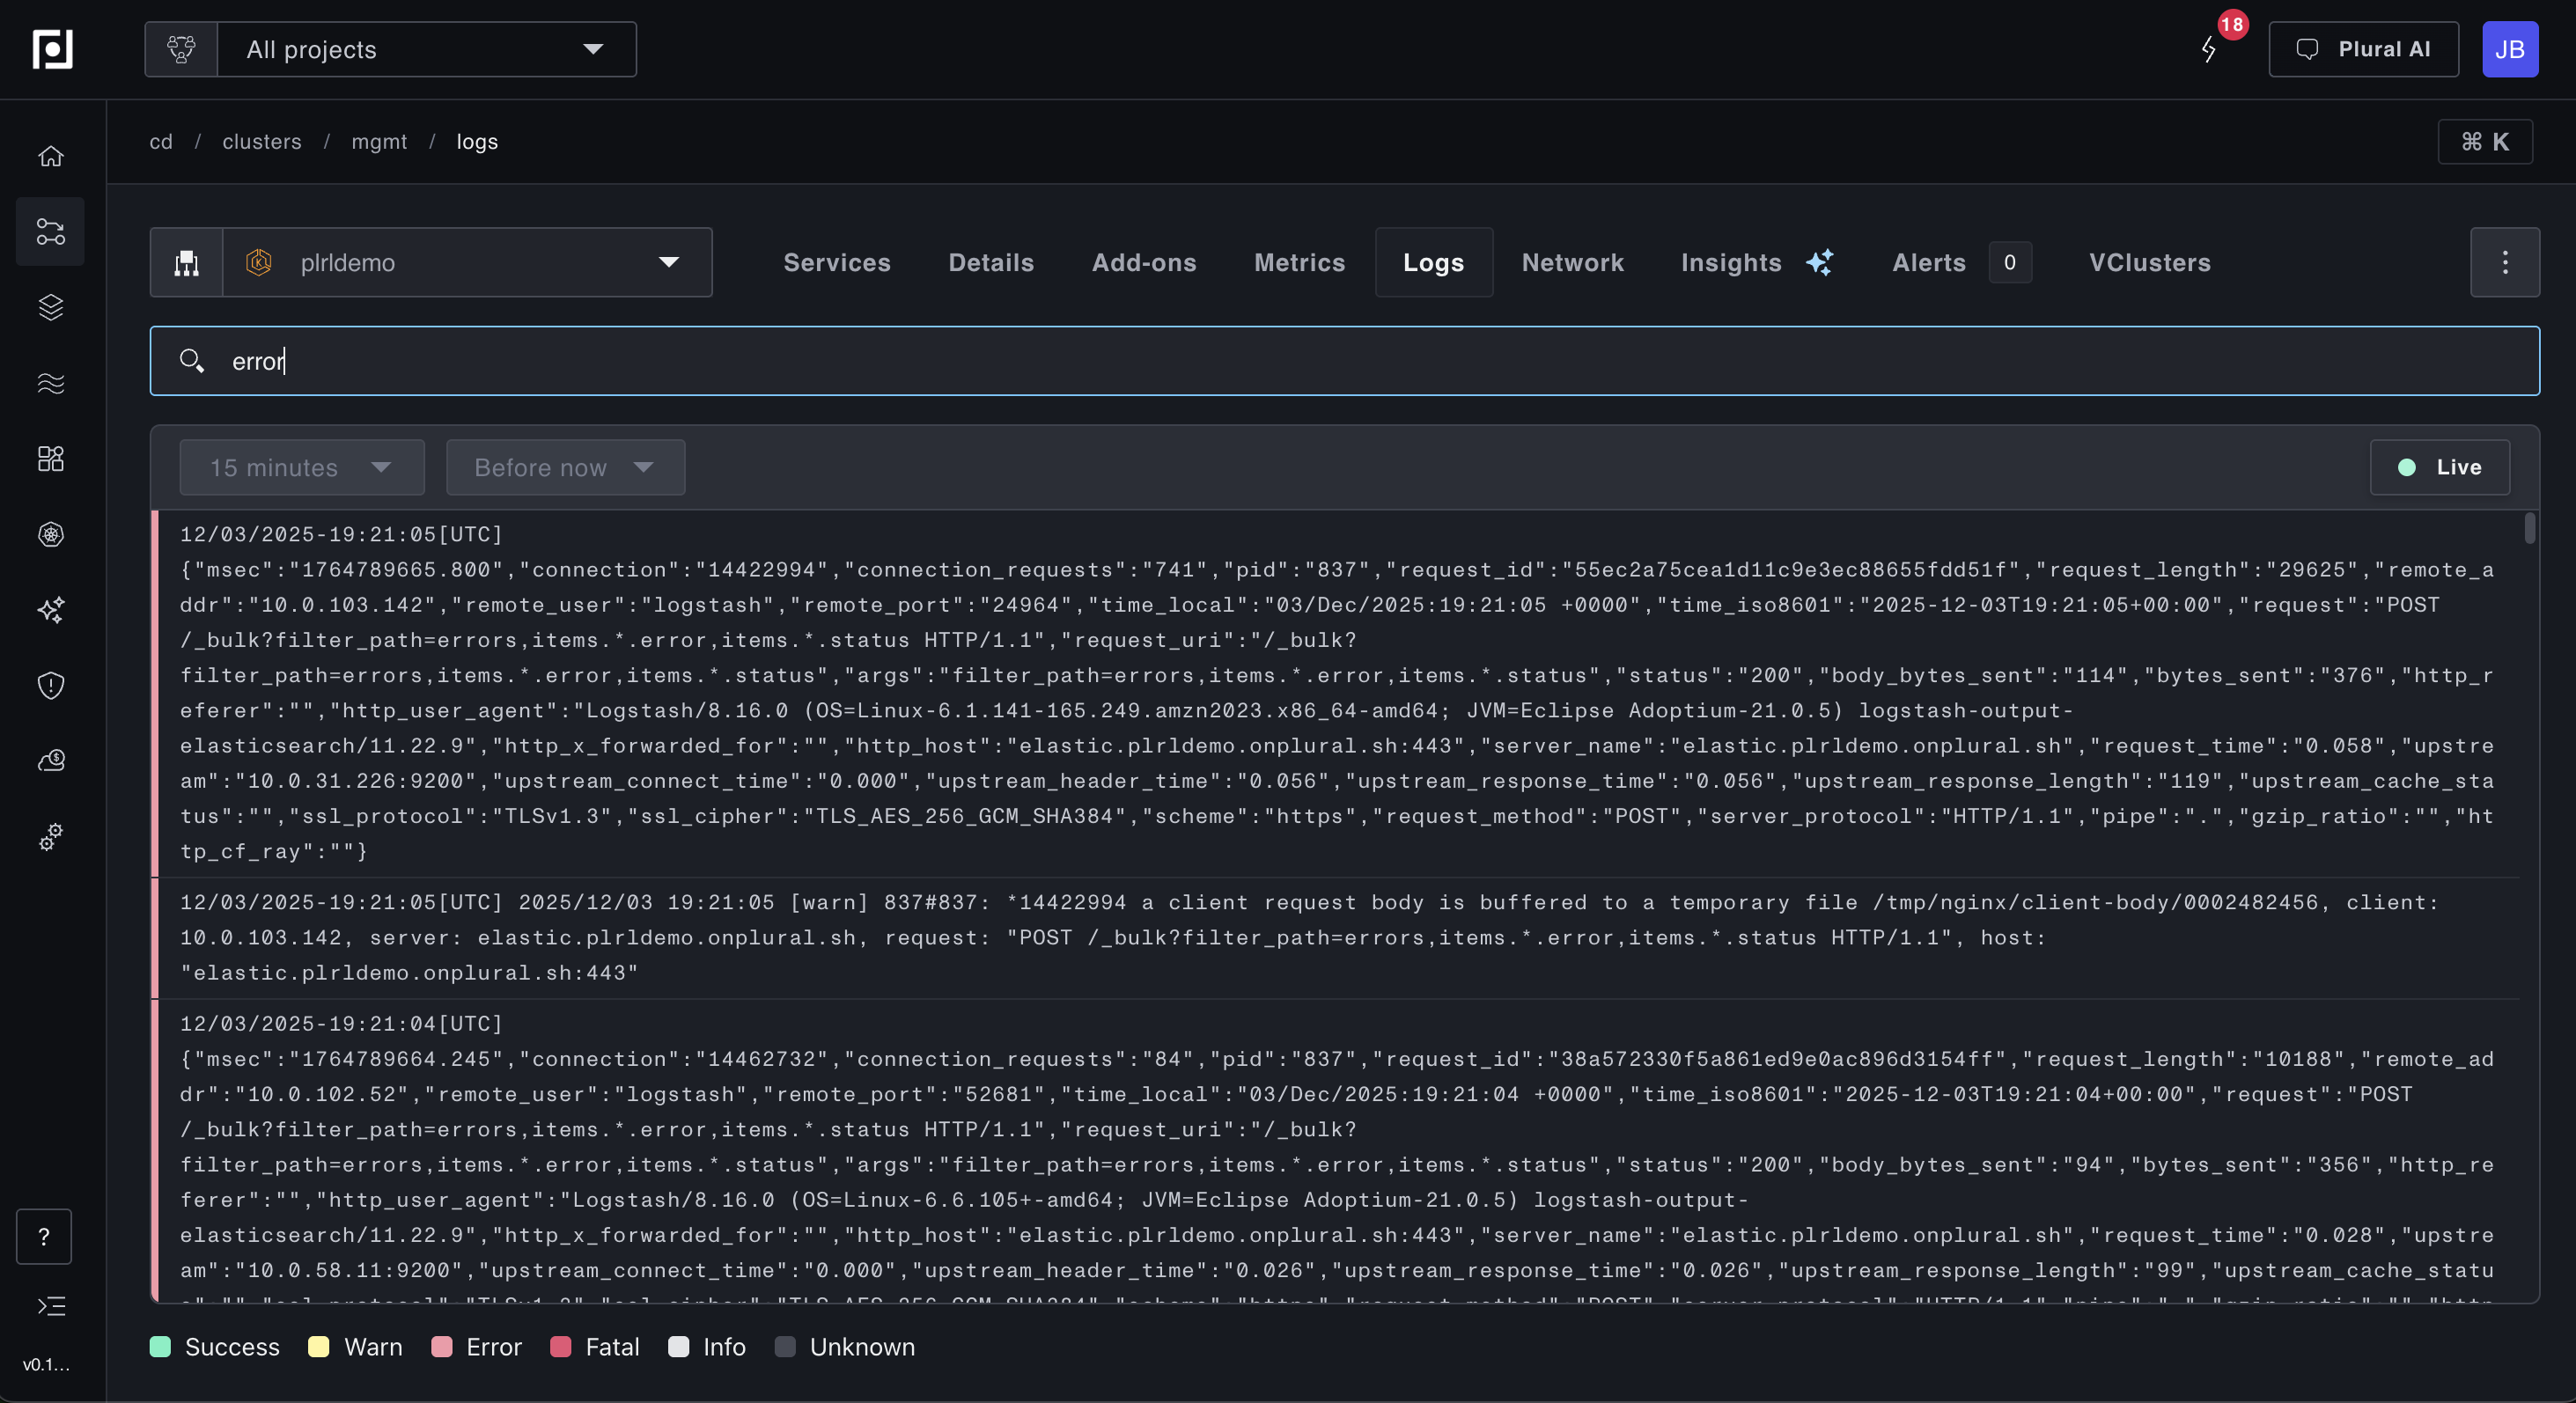
To filter logs by keywords or phrases, type into the search bar. Common use cases include searching for error messages, specific request IDs, pod names, or error codes. You can also search for multi-word phrases to narrow down results, as shown below.