Grafana Observability Webhook Integration
Configure Grafana webhook to view alerts and incidents inside the Plural Console.
Quick Setup
To install the Grafana Observability Webhook, navigate to the Settings tab in the Console sidebar. Go to Global Settings > Observability > Webhooks.
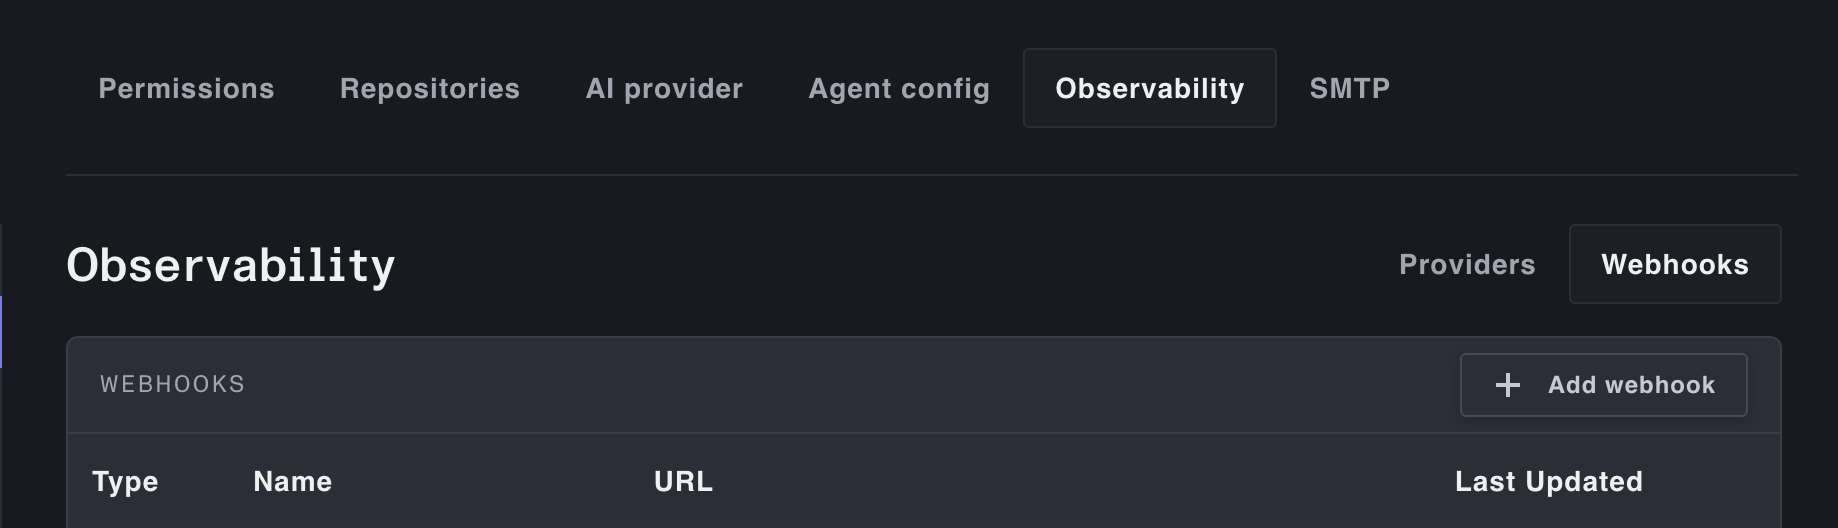
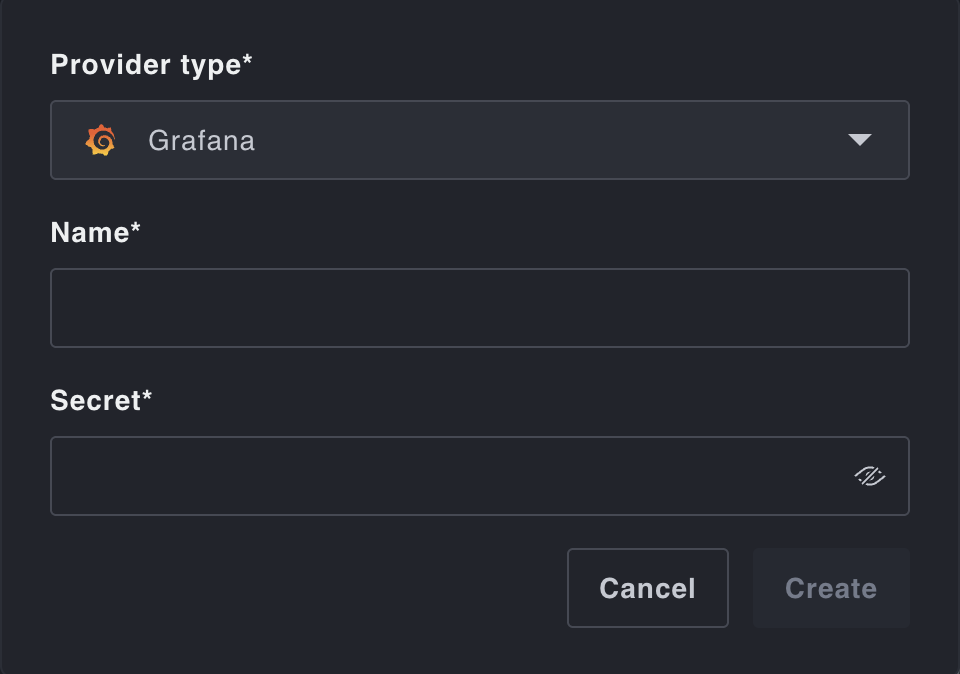
Click Add webhook. Give your Grafana Observability Webhook a name and fill in your base64 encoded Grafana basic auth token.
Take the URL that is generated and configure your Grafana webhook (in your Grafana UI) to point to it.

You will then be able to see alerts and incidents from Grafana as they appear in your Plural Console Logs.