Prometheus Configuration
Configure multi-cluster Prometheus with Plural
What You'll Get
Plural's leverages Prometheus for a few main purposes:
- Displaying saturation data for common compute controllers within Kubernetes, like deployments and statefulsets
- Displaying cluster-level aggregate metrics for CPU, memory, pod saturation, etc.
- Extracting network metrics for service mesh observability, in particular Istio and Cilium both have their standard network metrics shipped to Prometheus. We can use them to provide a holistic network graph and also use that information to inform Plural AI.
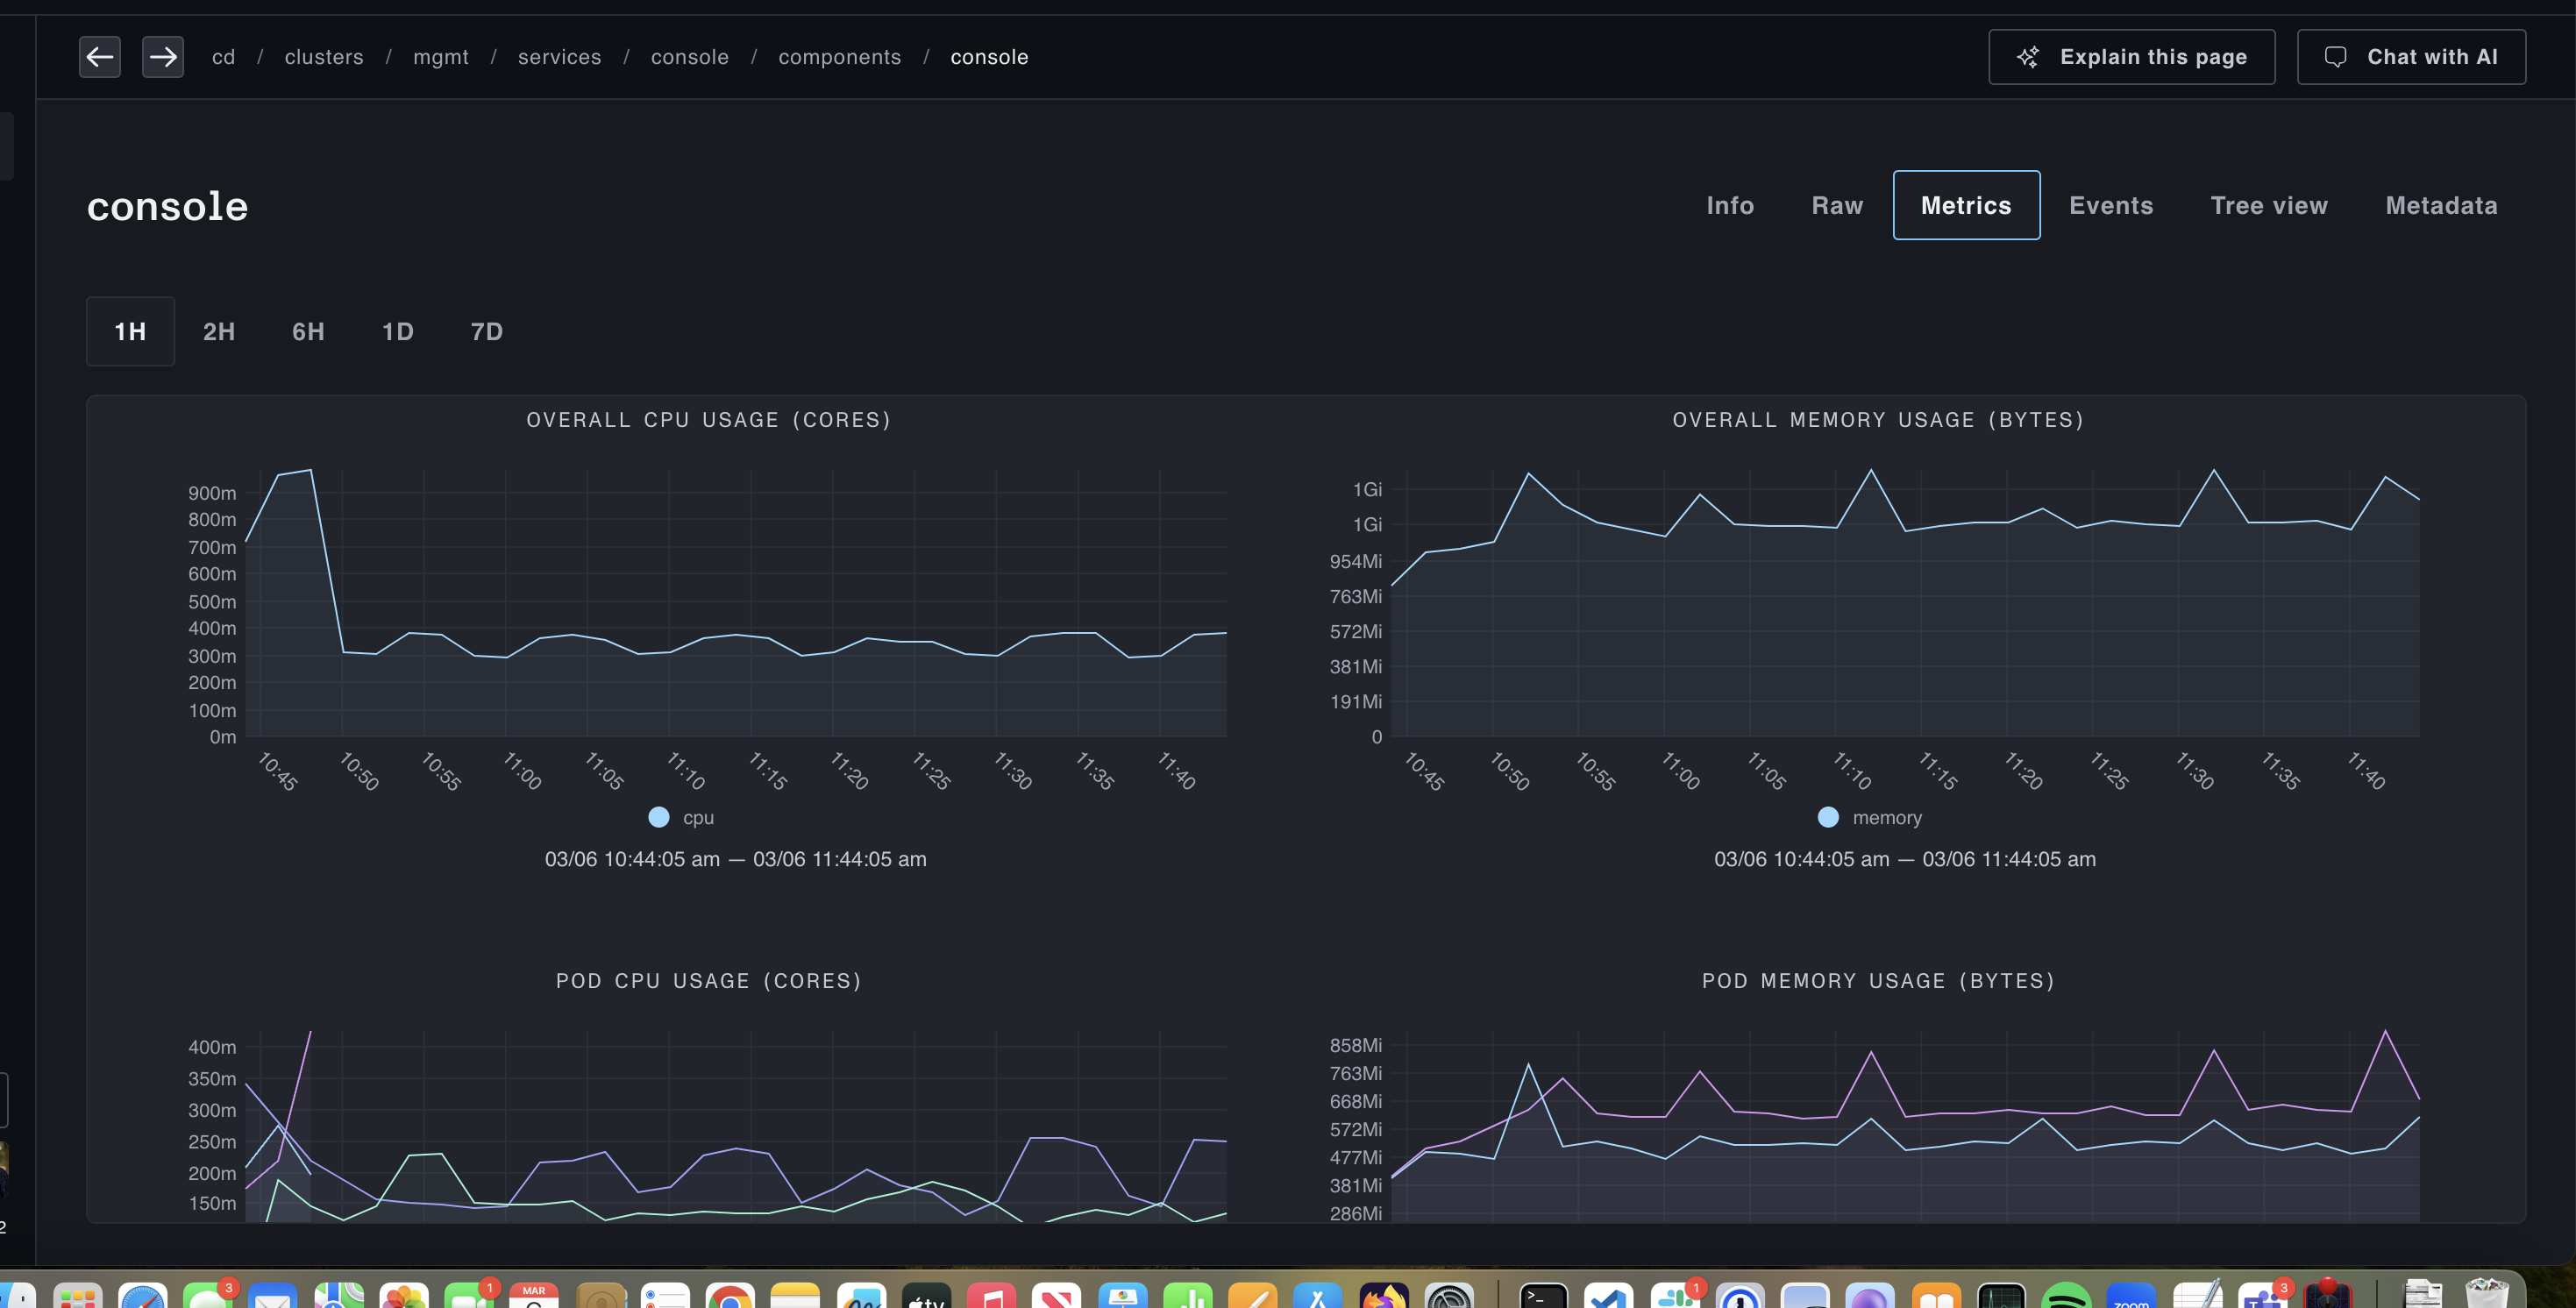
Once configured, if you go to a compute-related resource and click on the Metrics tab, you'll see something like:
And cluster saturation views will look like:

Deploy out of our Service Catalog
Plural ships by default with a full Service catalog to easily deploy solutions across your stack, among them a robust, scale-out setup of Prometheus using VictoriaMetrics. This solves a number of key problems with mainline Prometheus:
- Horizontal scaling - Prometheus scales only vertically, which is not an appropriate fit for monitoring large sets of kubernetes clusters which are going to emit a very large set of metrics and increases operational burden. VictoriaMetrics supports a horizontally scalable cluster mode, which solves this entirely
- Inefficient agent mode - Prometheus wasn't built for a remote-write model, and its agent mode still requires effectively a local prometheus store on-cluster.
vmagentis a much better implementation and also adds support for other protocols like statsd. Remote write is necessary for multi-cluster observabilty since you likely cannot ingress into all clusters to perform metrics scrapes. - Better kubernetes operator implementation - the mainline Prometheus operator has a number of longstanding issues, in particular not supporting volume resizing as discussed here