Running workbench jobs
Trigger agent runs, follow live activity, and interpret results
What is a workbench job?
A workbench job is a single execution of the workbench agent against a prompt. It has a lifecycle of pending → running → complete (or failed) and produces:
- A live activity stream of every step the agent took
- A structured result — a conclusion, optional todos, topology references, observability pointers, and any pull requests opened during the run
Jobs can be started manually from the UI, by a cron schedule, by a webhook trigger, or from a Plural Flow. You can also trigger a job by writing Plural fix this or Plural deploy this (or any instruction prefixed with "Plural") in a Jira ticket, GitHub PR comment, or other connected issue source — see Triggering jobs with "Plural" mentions.
Starting a job manually
Open a workbench, select the Launch tab, and type your prompt into the new-job input. Submit the prompt to start the job.

Saved prompts
Frequently used prompts can be saved under ••• → Saved prompts so your team can launch common investigations without retyping. When starting a job, select a saved prompt from the dropdown to pre-fill the prompt field.
The Jobs tab
The Jobs tab on each workbench shows all runs in reverse-chronological order with their status and the prompt they were triggered by.
You can filter the list to show only jobs triggered by an alert or issue using the filter controls at the top of the table.
Job detail: activities
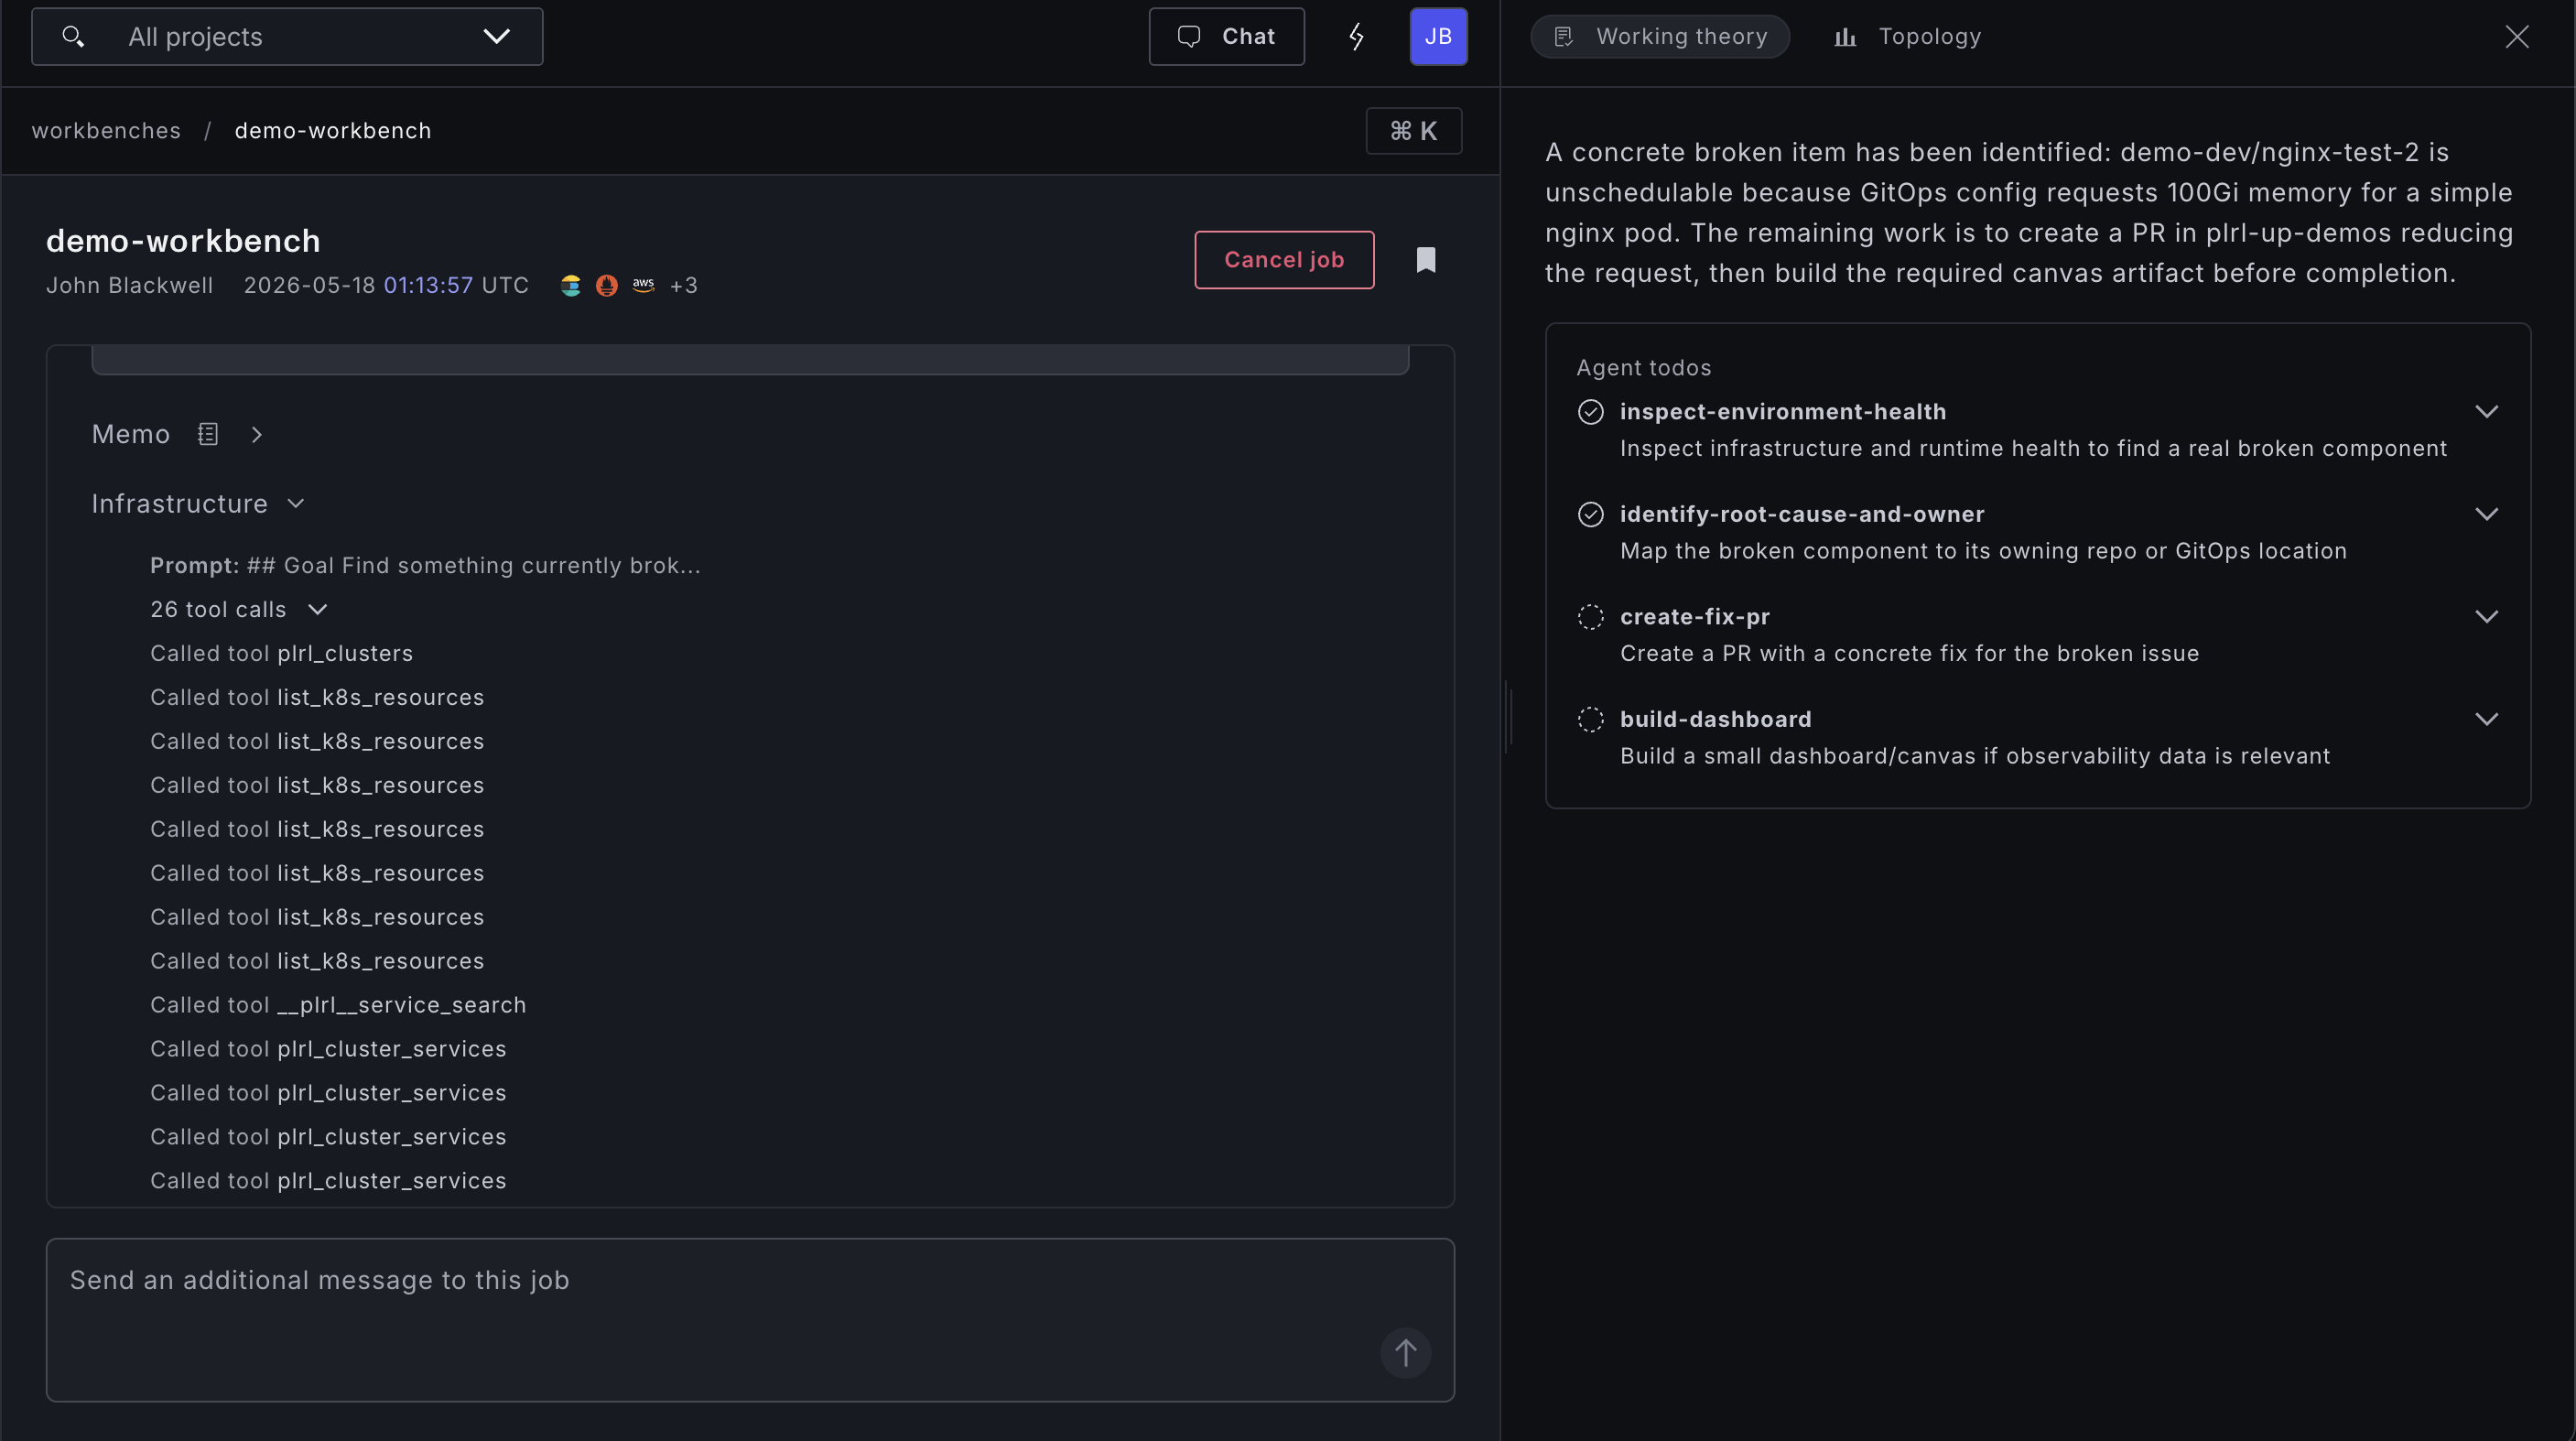
Click any job to open the job detail panel. The left side shows the live activity stream.
Activities are the agent's internal work log. Each activity is one of:
- Tool call — a call to a capability or attached tool, with the input and output
- Subagent result — the output of a spawned subagent that handled part of the work
- Thought — the agent's reasoning step (when visible in the selected runtime)
- Progress update — a summary of what has been done and what is still in progress
While a job is running, activities stream in real time. You do not need to refresh the page.
Job detail: result
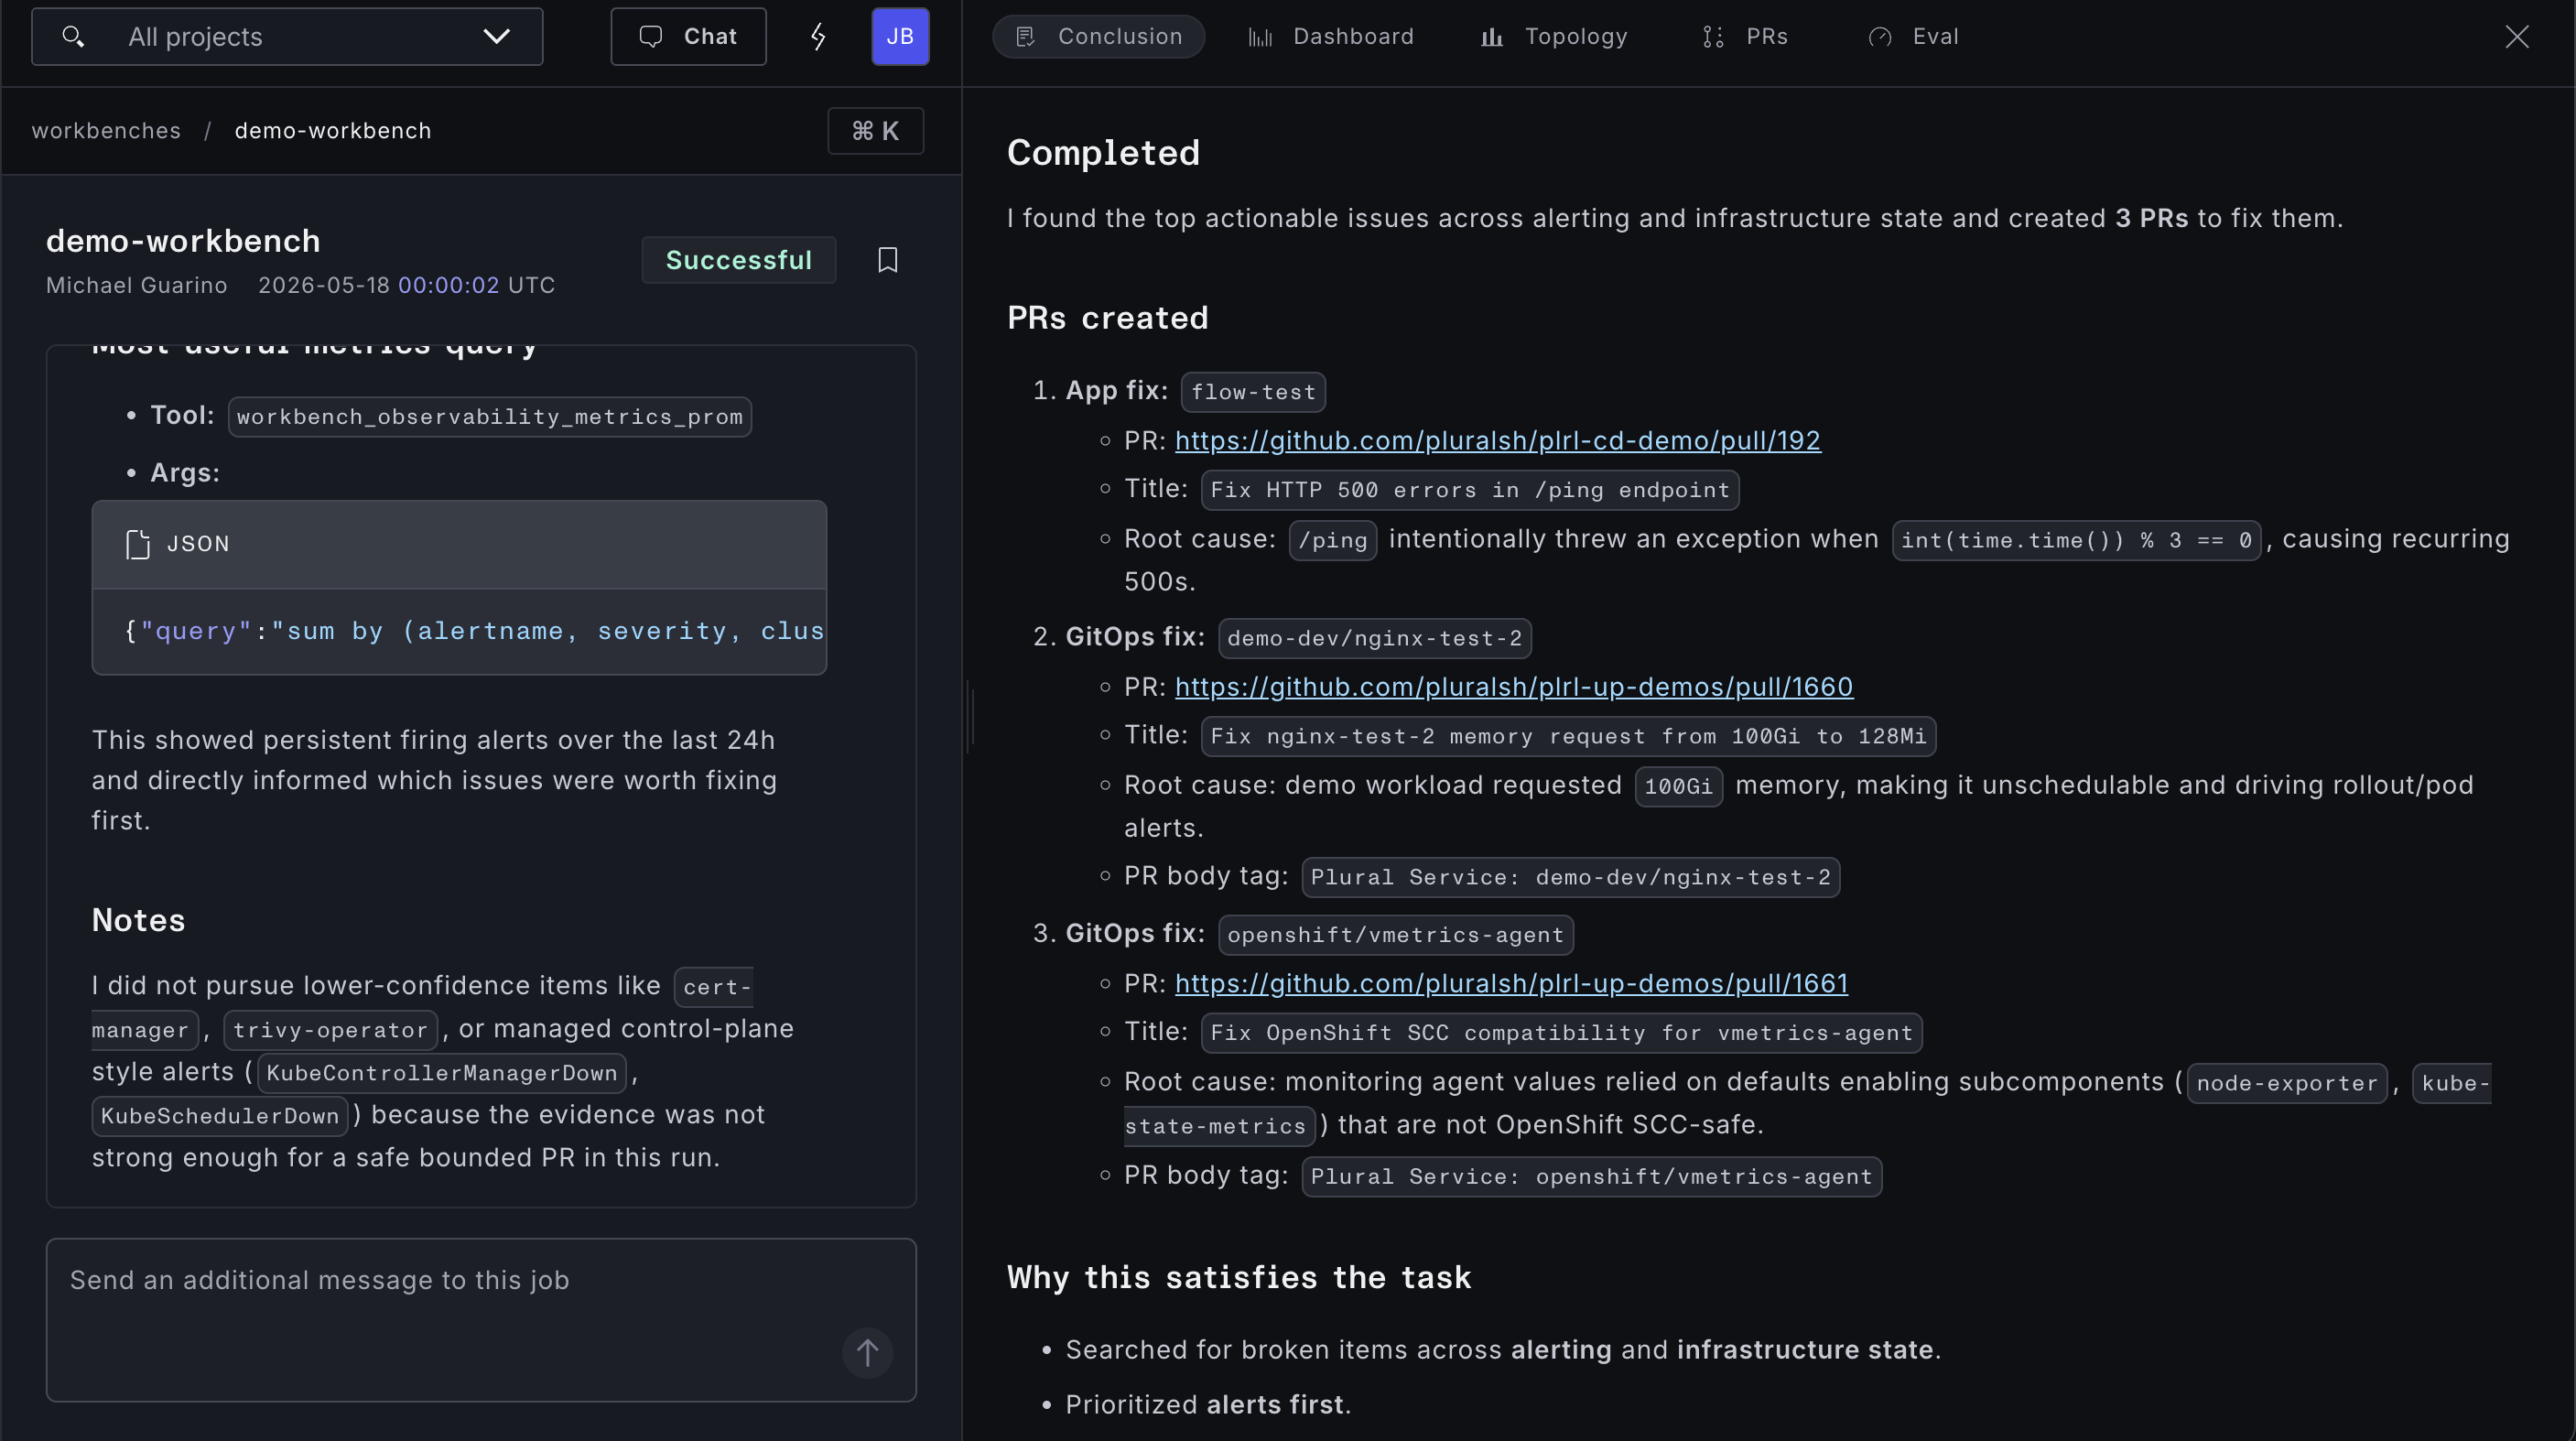
Once a job completes, the Result panel appears on the right side of the job detail view. It contains:
- Conclusion — a structured summary of what the agent found or did
- Todos — any follow-up tasks the agent identified that it could not complete itself
- Topology — references to the Plural services, clusters, or stacks the job touched
- Observability — pointers to the logs, metrics, or traces most relevant to the job's findings
- Pull requests — links to any PRs opened during the run (only present for workbenches in Write mode with a coding agent configured)
Canvas view
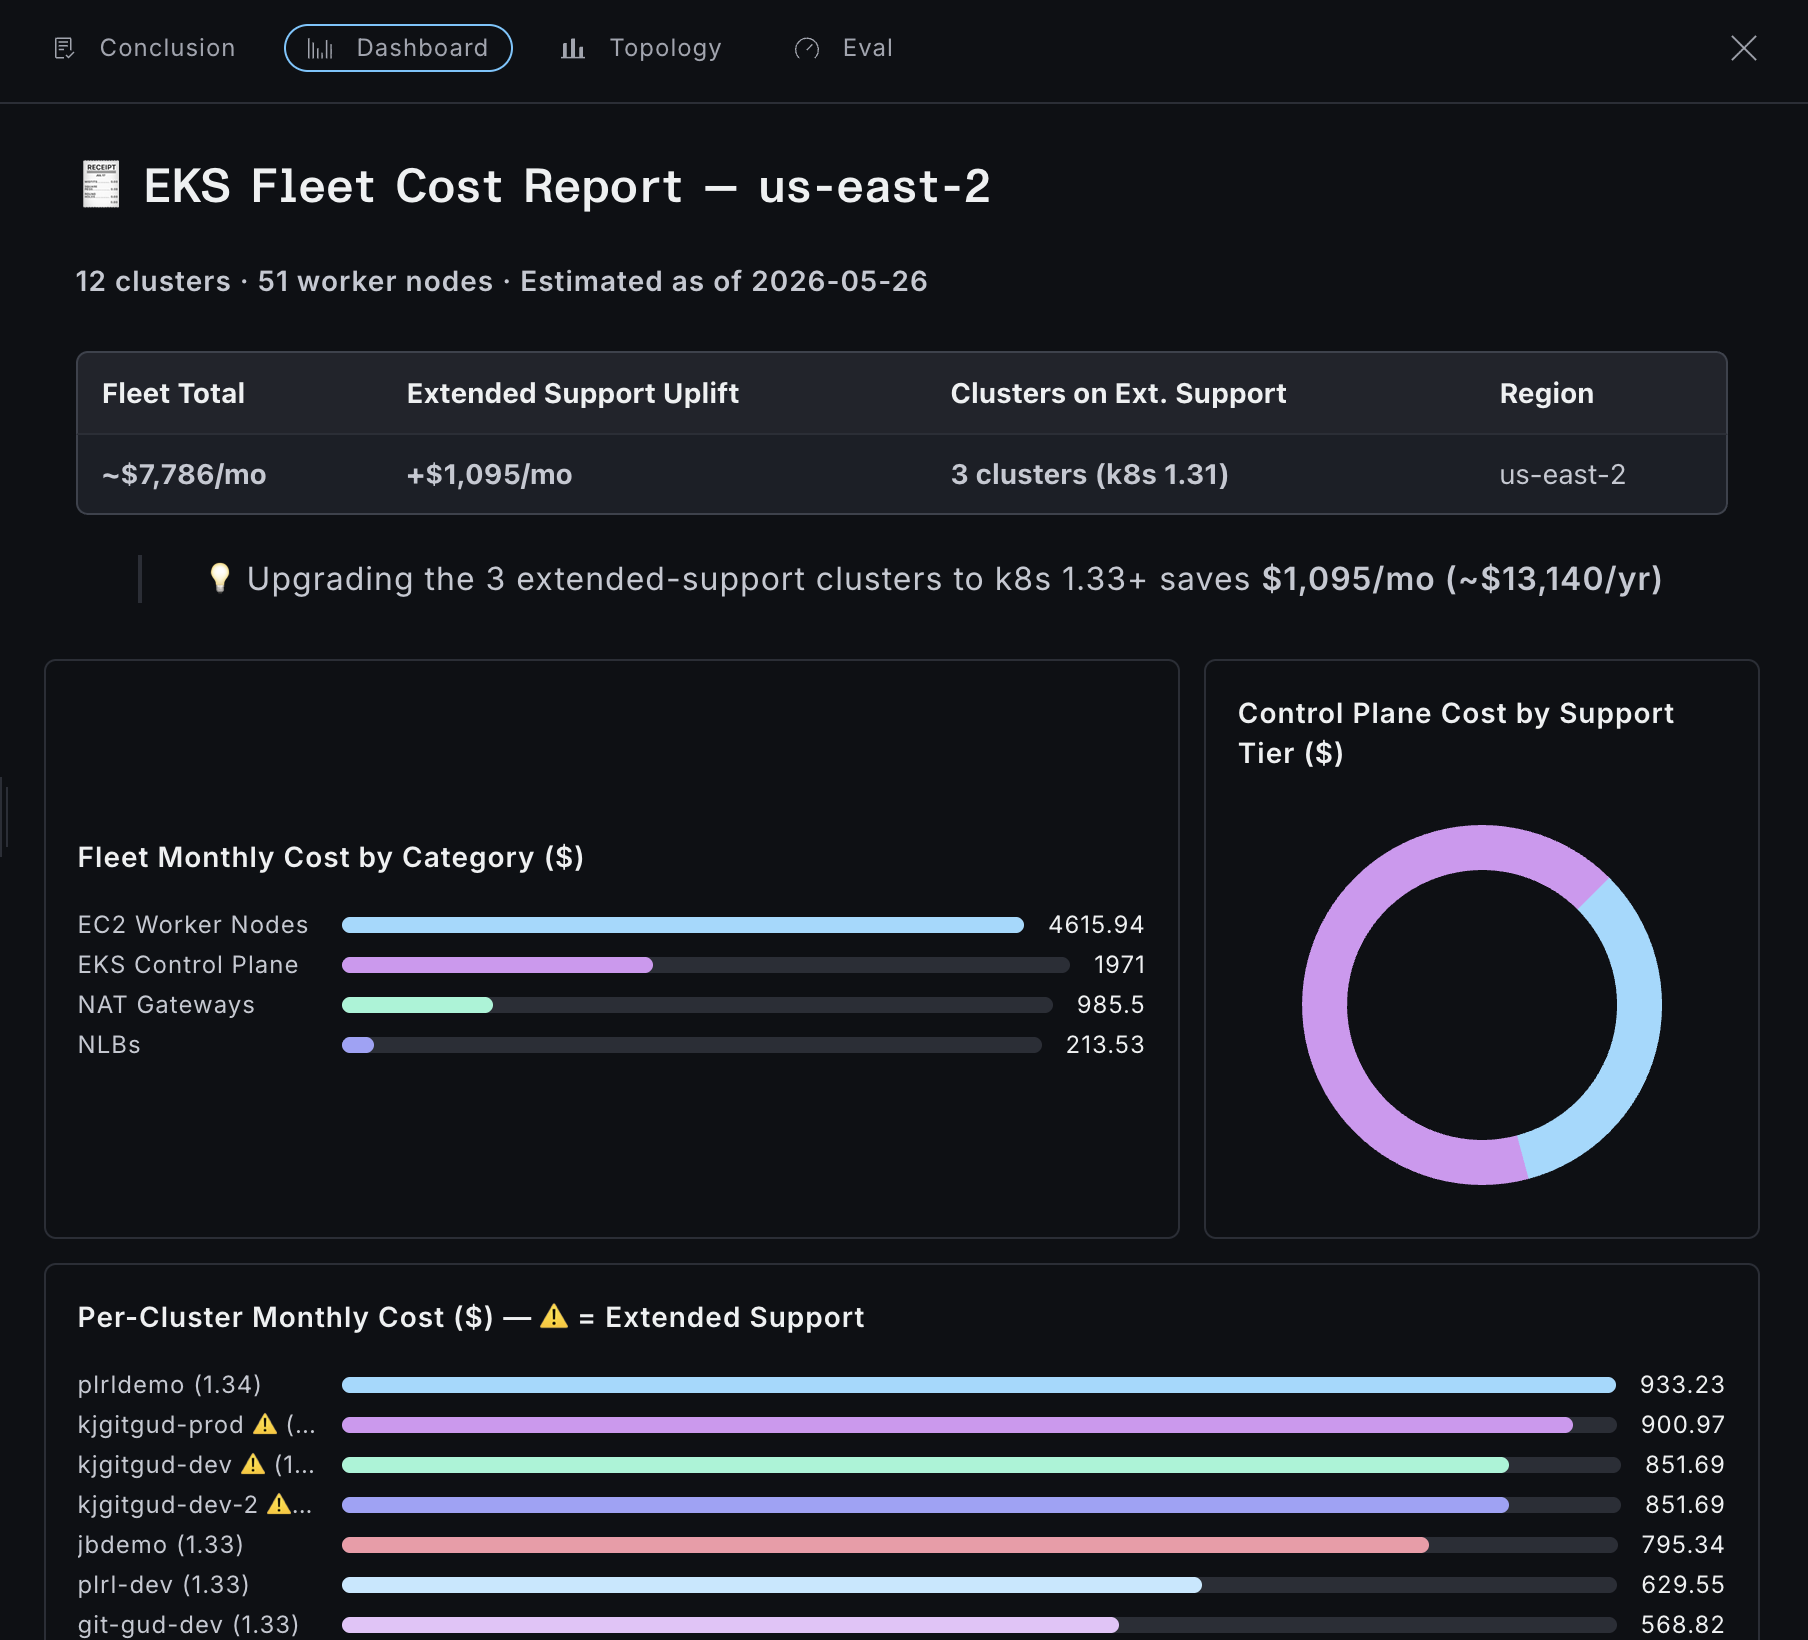
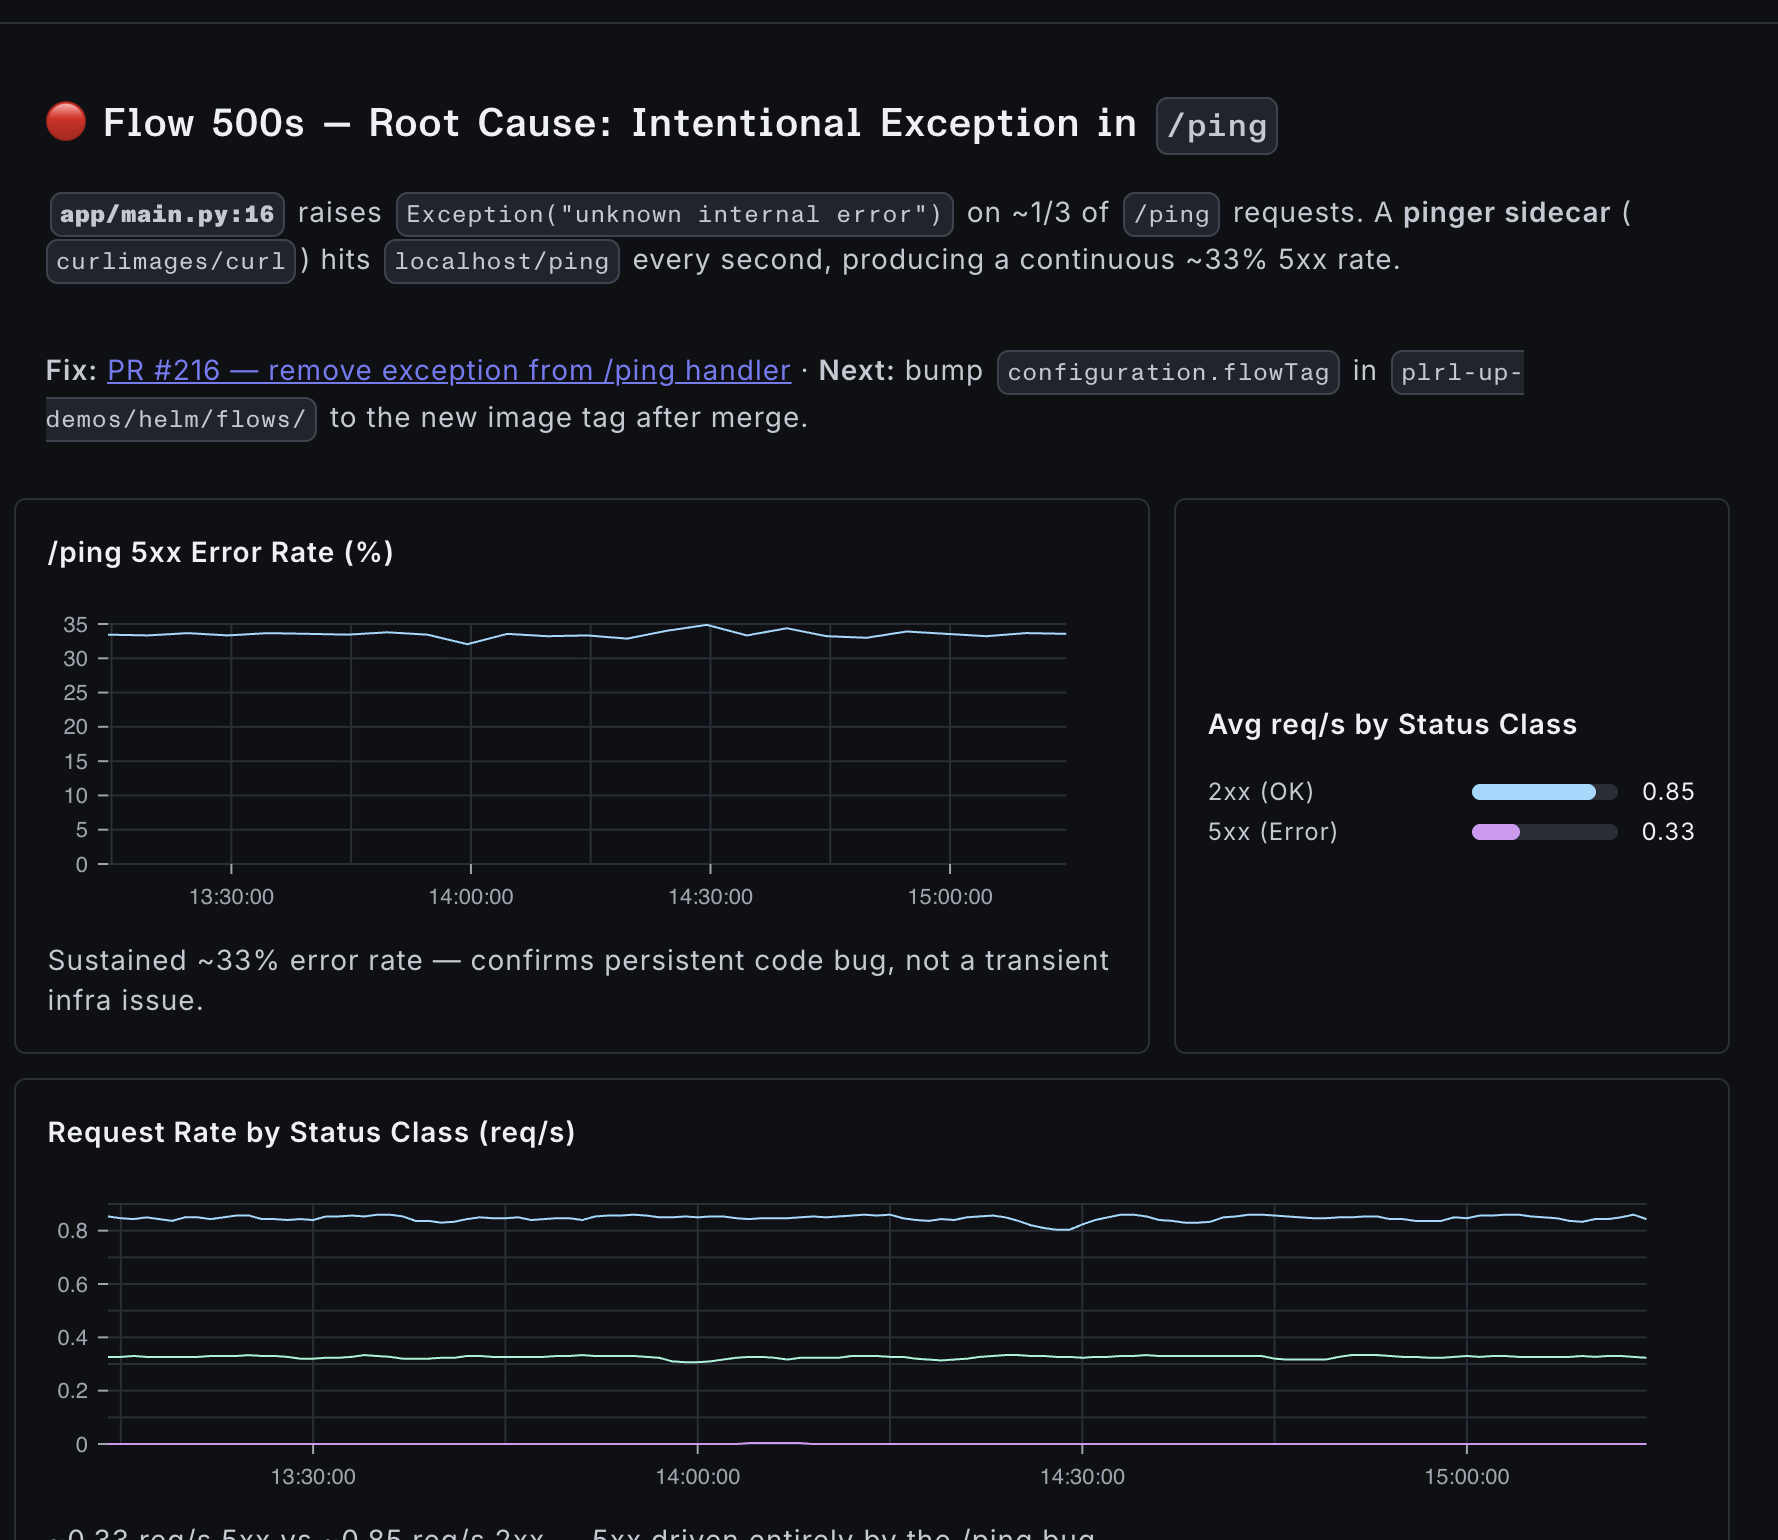
For jobs that produce a topology result, a Canvas button appears in the job detail header. The canvas renders an interactive dashboard of the data associated with a workbench job. This could be time-series metrics, bar or pie charts, or any other visualization the AI considers useful to give you a clear view of a potentially complex analysis. Think of it as an on-demand Datadog dashboard.
Here's an example for a cost analysis job:
And here is one for an alert analysis:
Alerts and issues tabs
If your workbench has webhook triggers configured for observability alerts or issue tracker events, the workbench will also surface an Alerts and/or Issues tab. These tabs list every alert or issue that has triggered a workbench job, with a link to the job that handled it.
This gives you an at-a-glance view of how automated incident response is performing without having to dig through the full job list.
Re-running a job
From the job detail panel, click Re-run to start a new job with the same prompt. This is useful when you have fixed an issue and want to confirm the agent now sees a clean state.