Common use cases
Worked examples for alert RCA, Slack incident response, cost analysis, and infrastructure self-service
The patterns below each represent a complete workbench setup for a common operational need. For each one, the agent's behavior is shaped by skills — pre-built instruction documents from Plural's skills library, or custom runbooks from your own Git repository. You do not need to write a system prompt from scratch; attach the relevant skills for the use case and add a brief system prompt to orient the agent to your platform if needed.
Alert root cause analysis
Automatically investigate every firing alert and produce a structured root cause analysis with remediation suggestions.
How it works
When an alert fires in Datadog, Grafana, or another supported provider, a webhook trigger creates a workbench job. The agent immediately begins querying the relevant service, its Kubernetes resources, logs, and metrics. When it finishes, the job result contains a diagnosis, the signals that led to it, and concrete next steps.
Setup
Capabilities:
- Infrastructure: Services, Kubernetes, Pod logs
- Observability: Metrics, Log aggregation
Tools: Attach a Prometheus or Datadog tool with credentials for your metrics backend.
Webhook trigger:
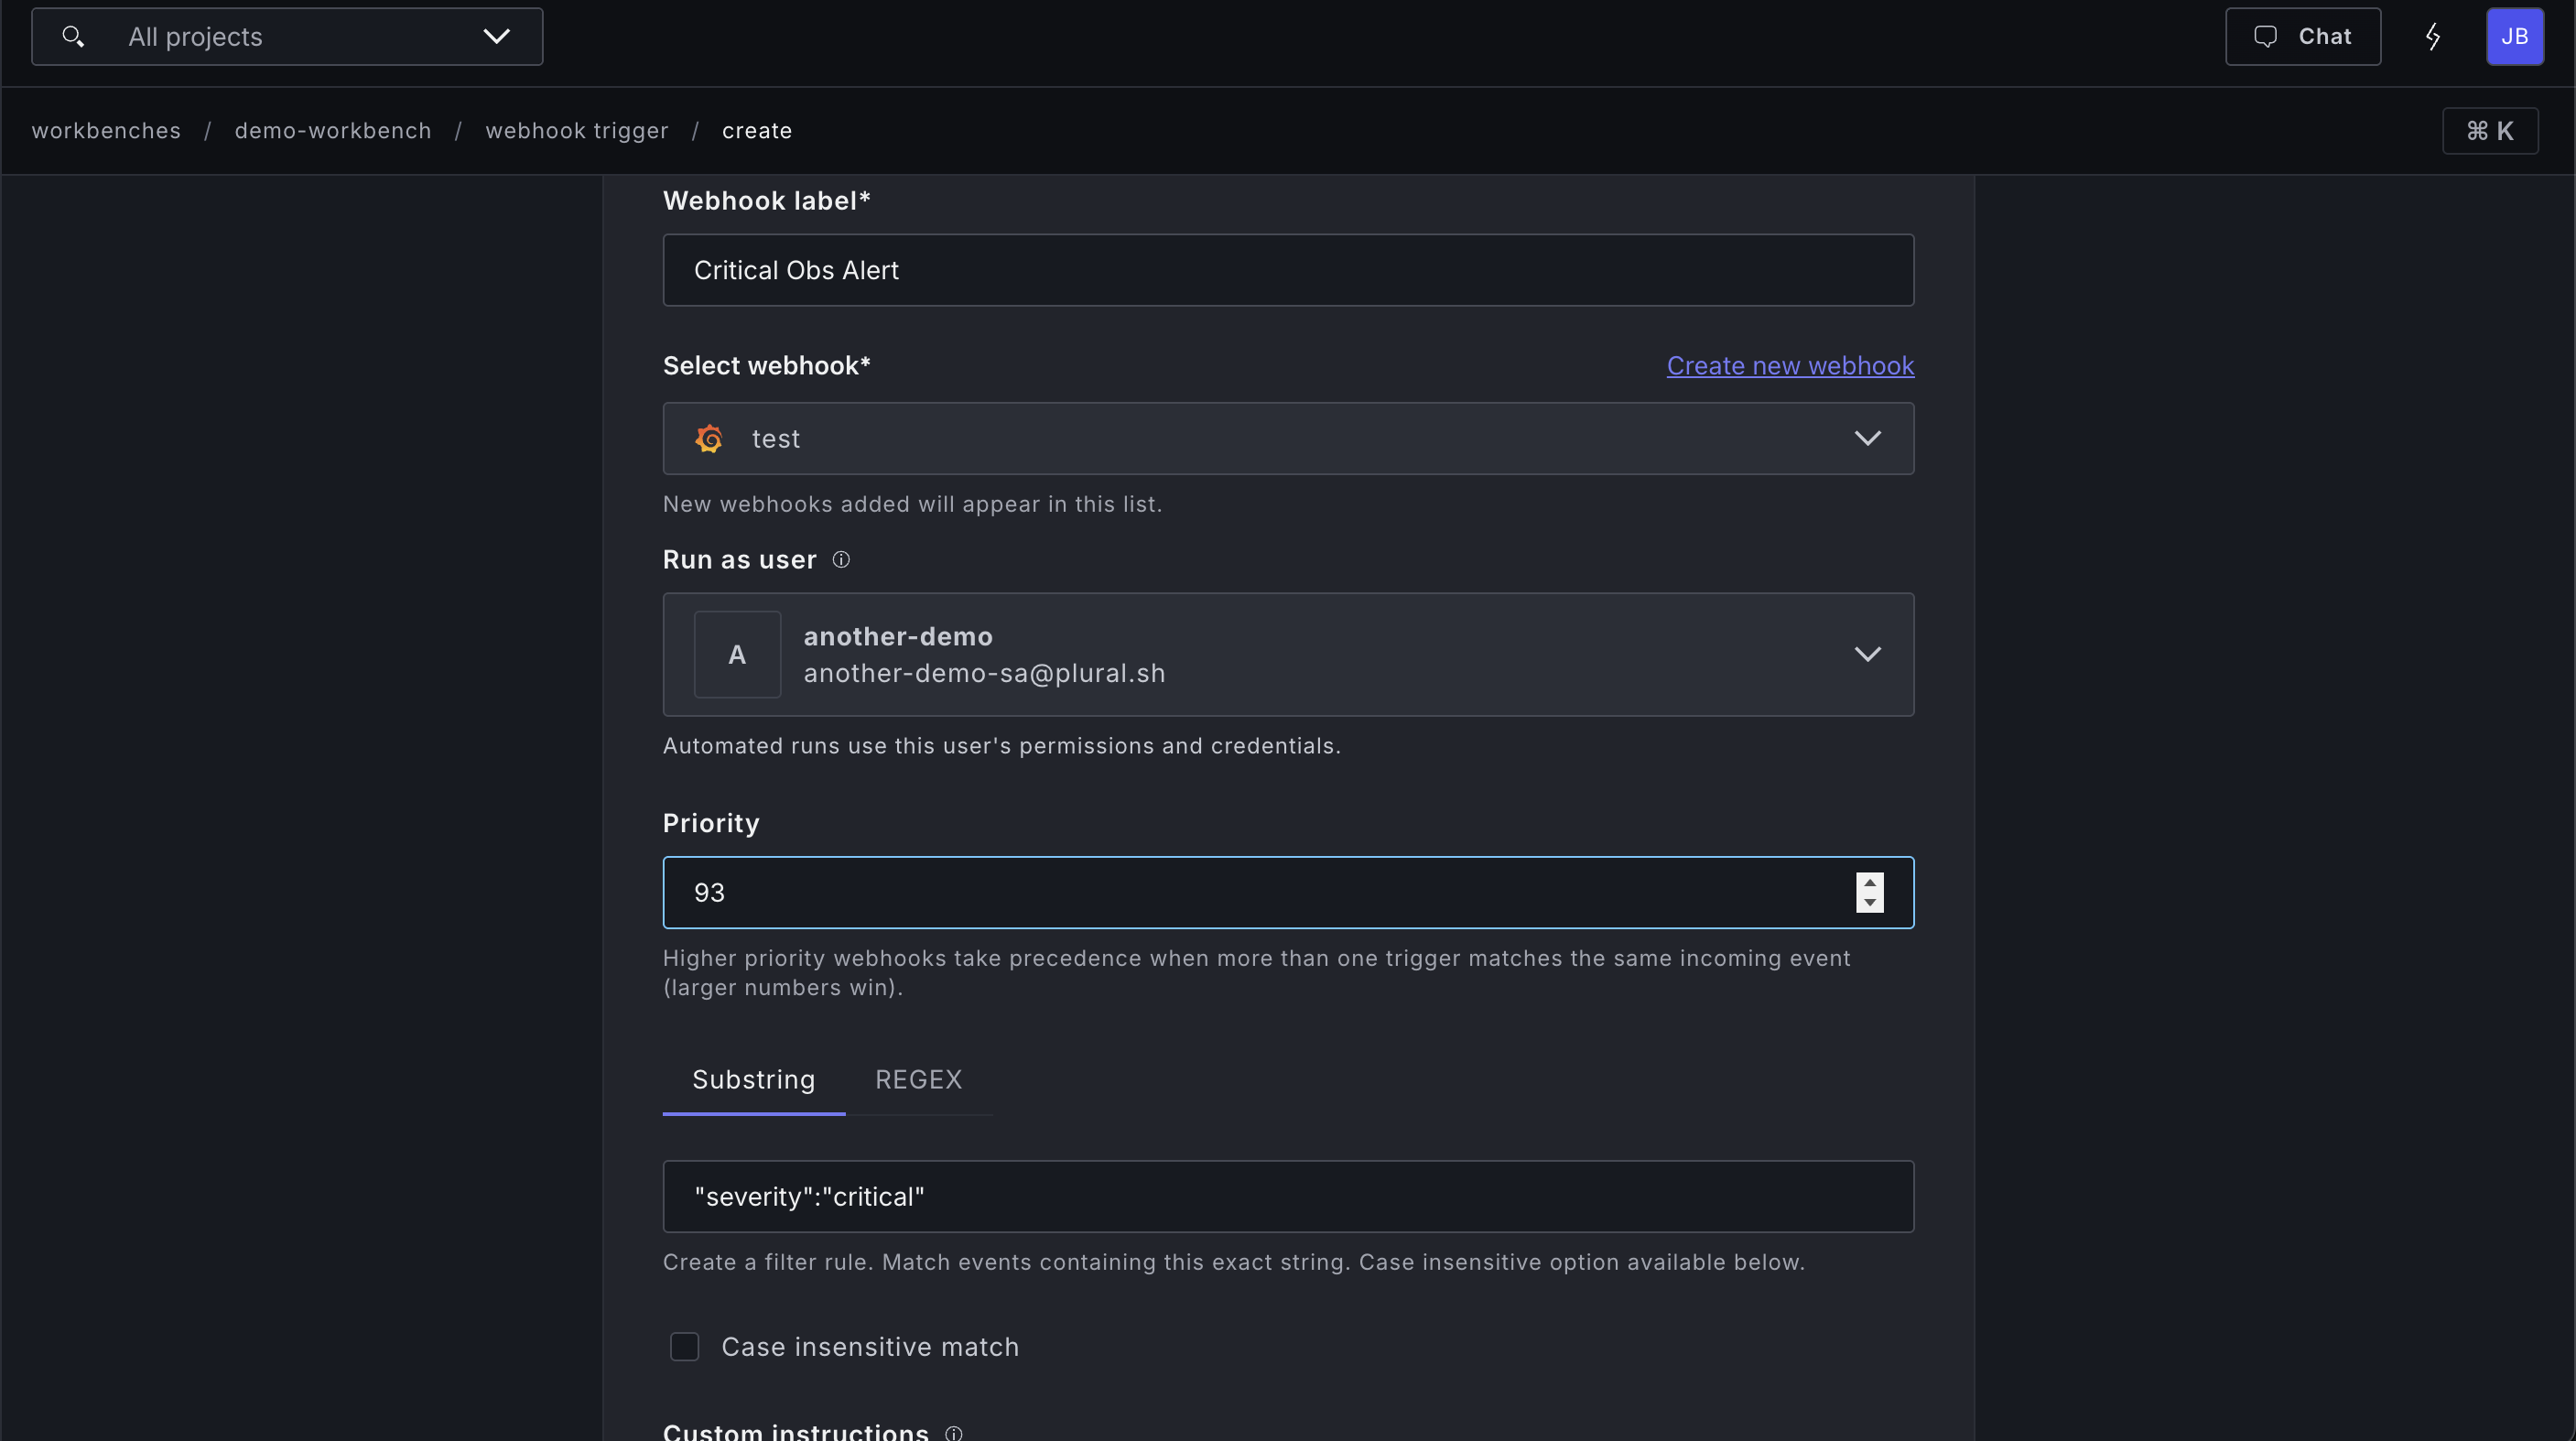
Navigate to ••• → Webhook trigger and create a trigger on your Datadog (or Grafana) observability webhook. Use a regex or substring match to scope it to the alerts you want to handle — for example, match "severity":"critical" to only fire on critical alerts.
Cron schedule (optional): Add a @daily cron with a prompt asking for a summary of all alerts that fired in the last 24 hours and their current status, to get a morning digest.
Slack incident channel creation
When an alert fires, automatically create a dedicated Slack channel for the incident, invite the on-call team, and post an initial situation report.
How it works
A webhook trigger fires on high-severity alerts. The agent creates a named Slack channel, invites the appropriate responders, and posts the initial context — service status, recent errors, and any topology it can infer from the alert. The on-call team joins a channel that already has the first five minutes of investigation done for them.
Setup
Capabilities:
- Infrastructure: Services, Kubernetes, Pod logs
Tools: Attach a Slack tool configured with a bot token that has channels:manage, channels:join, and chat:write scopes.
Webhook trigger:
Create a trigger on your observability webhook targeting high-severity or production alerts only — for example, a substring match on "env":"production" combined with a check for your critical tag.
Cost information and reporting
Query cloud spend, surface cost anomalies, and deliver accurate cost reports to your team — without navigating billing dashboards.
How it works
Plural runs its own automation around Steampipe to expose your cloud provider's APIs as queryable foreign tables inside a PostgreSQL-compatible database. Under the hood, the cloud-query service loads Steampipe's Postgres FDW extensions (steampipe_postgres_aws, steampipe_postgres_gcp, steampipe_postgres_azure) and imports a per-connection foreign schema so every cloud API becomes a regular SQL table.
The agent gets three tools for each attached Cloud connection:
cloud_schema— inspect column definitions for a specific tablecloud_tables— discover what tables are available (e.g.aws_costexplorer_cost_and_usage,gcp_billing_budget)cloud_query— run arbitrary PostgreSQL-compatible SQL against the imported foreign schema to fetch real data
Rather than asking the LLM to estimate or recall numbers, the agent queries the actual billing APIs through SQL and uses a built-in calculator tool for all arithmetic — percentage changes, totals, deltas — so the numbers in the final report are computed, not guessed.
This SQL + calculator approach is a deliberate design choice to eliminate hallucination. LLMs are unreliable at arithmetic; the agent never does math in its head.
A cron schedule fires weekly (or on demand), and the agent queries cost tables, aggregates by service or team tag, identifies anomalies relative to prior periods, and posts a summary to a Slack channel. The same workbench handles ad-hoc questions from engineers.
Setup
Capabilities: None required — all data comes from the attached Cloud tool via SQL.
Tools:
- Attach a Cloud tool (AWS, GCP, or Azure) backed by an IAM role with read-only billing access. For AWS, this means
ce:GetCostAndUsageandce:GetCostForecaston Cost Explorer. For GCP, the Billing Account Viewer role. For Azure, Billing Reader. - Optionally attach a Datadog or Prometheus tool to correlate cost with resource utilization metrics.
- Optionally attach a Slack tool to deliver reports to a channel automatically.
Cron schedule:
Create a schedule with crontab 0 9 * * 1 (Monday at 09:00 UTC) and a prompt asking for the weekly cost report posted to your cost channel.
Ad-hoc use:
Because the workbench is also available for manual jobs, engineers can open it and ask specific questions directly:
What did we spend on RDS last month compared to the month before?Which EKS nodes are driving the most compute cost this week?Is our staging environment spend unusually high right now?
Ticket-driven infrastructure self-service
Let engineers request infrastructure changes through your issue tracker, and have the agent fulfill — or at least draft — the change automatically.
How it works
An engineer creates a Jira or Linear ticket describing the infrastructure change they need (scale a service, provision a new environment, update a config value). A webhook trigger fires when the ticket is created with a specific label or in a specific project. The agent reads the ticket, translates the request into the appropriate infrastructure operation, opens a PR against your GitOps repo with the change, and comments back on the ticket with the PR link and a summary of what it did.
Setup
Capabilities:
- Infrastructure: Services, Stacks, Kubernetes
Coding agent: Enable with Write mode. Add your GitOps infrastructure repository to the allowed repositories list. See Coding agent for setup instructions.
Tools:
- Attach a Jira (Atlassian) or Linear tool so the agent can read ticket details and post comments.
- Optionally attach a GitHub, GitLab, or Bitbucket tool if you want the agent to directly interact with your SCM beyond what the coding agent handles.
Webhook trigger:
Register a Jira issue webhook in Plural and configure the Jira webhook to fire on issue creation. Set the trigger to match on the label or project that signals an infra request — for example, substring match on "infra-request" in the payload, or a regex that matches your specific Jira project key.
Babysitting: Consider enabling babysitting on the coding agent while the workbench is new. The agent then stays on each pull request it opens, watching CI and review comments and pushing additional commits until the PR is green, so you don't have to shepherd its early PRs by hand.