Tools
Configure external integrations for your workbench agents to call
Overview
Tools are reusable external integrations that workbench agents can call as part of a job. They are configured globally and then attached to individual workbenches, so the same Datadog connection or MCP server can be shared across multiple workbenches without re-entering credentials.
Navigate to Workbenches → Integrations to browse the available tool types, or Workbenches → Configured tools to manage the tools you have already set up.

Tool types
Plural native integrations
These capabilities are built directly into the workbench runtime and require no external credentials or tool setup. They are enabled per workbench via the capability toggles in Step 1 of the creation wizard.
| Capability | What the agent can access |
|---|---|
| Services | Plural-managed service deployments — health status, rollout history, configuration, and associated cluster |
| Stacks | IaC stack runs, Terraform state summaries, run logs, and failure details for Plural-managed stacks |
| Kubernetes | Full Kubernetes API access across your managed clusters — list and describe any resource (Deployments, Pods, Events, ConfigMaps, etc.) |
| Pod logs | Raw container stdout/stderr streamed directly from Kubernetes pods |
| Vulnerabilities | Trivy vulnerability findings auto-associated with Plural-managed services |
| Metrics | Query your configured Prometheus-compatible metrics backends via Plural's observability integration |
| Log aggregation | Search and aggregate logs from your configured backends (Loki, Elastic, etc.) via Plural's observability integration |
All native integrations respect your existing RBAC — enabling a capability here does not grant the agent access it would not otherwise have.
Observability
| Tool | What the agent can do |
|---|---|
| Prometheus | Run PromQL range queries and discover metric names, label names, and label values on a Prometheus-compatible endpoint |
| Datadog | Query metrics, logs, and traces from the Datadog API |
| Loki | Query log streams and aggregate log counts from a Loki-compatible endpoint using LogQL |
| Elastic | Search logs and aggregate log counts from an Elasticsearch index with text queries and exact-match facets |
| Splunk | Search logs stored in Splunk Enterprise or Splunk Cloud using SPL queries via the management REST API |
| VictoriaLogs | Query logs and aggregate log counts from a VictoriaLogs endpoint using LogsQL |
| OpenSearch | Search logs and aggregate log counts in an Amazon OpenSearch Service index with SigV4-signed requests |
| CloudWatch | Query metrics with metric math, run Logs Insights queries, and read dashboards and alarms in one AWS region |
| Dynatrace | Query Grail metrics, logs, and spans with DQL, and read dashboards and anomaly-detection settings |
| Azure Monitor | Query Azure Monitor metrics (or Managed Prometheus with PromQL) and Log Analytics logs with KQL, and read dashboards and alert rules |
| Tempo | Query distributed trace spans from a Grafana Tempo endpoint |
| Jaeger | Query distributed trace spans from a Jaeger backend with filters for service, operation, duration, and attributes |
Incident & error management
| Tool | What the agent can do |
|---|---|
| PagerDuty | Read incident details, notes, and log entries from the PagerDuty REST API |
| Sentry | Read issues, events, and stack traces from the Sentry API |
Source control
| Tool | What the agent can do |
|---|---|
| GitHub | Read, list, and search issues, pull requests, and repositories (including diffs, checks, and reviews); read code scanning, Dependabot, and secret scanning alerts; comment on, review, and close pull requests |
| GitLab | Read merge requests and issues with their notes, post and edit notes, award emoji, and close merge requests without merging |
| Bitbucket Cloud | Read pull requests and issues with their comments, post and edit comments, and decline pull requests without merging |
| Bitbucket Data Center | Read pull requests and their comments, post, reply to, and edit comments, and add emoji reactions on self-hosted Bitbucket Data Center |
| Azure DevOps | Read pull requests with comment threads and work items with comments, post and edit comments, add reactions, and abandon pull requests |
Messaging
| Tool | What the agent can do |
|---|---|
| Slack | Find channels, read channel history, post and edit messages (including thread replies), add reactions, create channels, and invite users or user groups |
| Microsoft Teams | Post messages to Teams channels |
Issue tracking
| Tool | What the agent can do |
|---|---|
| Atlassian | Call Jira and Confluence Cloud via Atlassian's MCP server — search, create, and update issues; read and edit pages |
| Jira Cloud | Search, create, update, comment on, and transition Jira Cloud issues with JQL queries |
| Jira Data Center | Search, create, update, comment on, and transition Jira Data Center issues on self-hosted instances |
| Linear | Find, create, and update Linear issues, projects, and comments through Linear's hosted MCP server |
| ServiceNow | Create, read, update, and comment on incidents, change requests, problems, and catalog tasks |
Cloud
Cloud tools are backed by a cloud connection (an IAM role or credential set stored in Plural) and give the agent SQL-queryable access to cloud-provider data via Plural's Steampipe-based cloud query service.
Rather than asking the LLM to reason about cloud state from natural language descriptions, the agent uses three dedicated tools to work with cloud data precisely:
| Agent tool | What it does |
|---|---|
cloud_tables | Lists available SQL tables for the cloud connection — the agent calls this first to discover what data it can query |
cloud_schemas | Returns the column names and types for an exact list of tables |
cloud_query | Executes a PostgreSQL-compatible SQL query against the cloud account's data |
The agent is also always equipped with a calculator tool that evaluates arithmetic expressions deterministically. This means any aggregation, percentage change, or cost total is computed — never estimated by the LLM — eliminating hallucination on numerical results.
| Provider | Coverage |
|---|---|
| AWS | Cost Explorer, EC2, RDS, S3, CloudWatch, EKS, and more |
| GCP | Compute Engine, GKE, Cloud SQL, Billing, and more |
| Azure | VMs, AKS, storage, Azure Monitor, and more |
A cloud connection can also back a serverless function tool, which the agent calls with a JSON input:
| Tool | What the agent can do |
|---|---|
| Lambda | Invoke an AWS Lambda function you describe with a JSON input schema, optionally behind human approval |
| Cloud Run | Call a Google Cloud Run service with a JSON body, optionally behind human approval |
| Azure Function | Call an HTTP-triggered Azure Function with a JSON body, optionally behind human approval |
Web search
| Tool | What the agent can do |
|---|---|
| Exa | Search the web and read pages by URL through Exa's hosted MCP server |
Container registries
| Tool | What the agent can do |
|---|---|
| Docker registry | Search repository tags, find the latest semver versions, and fetch image manifests from Docker Hub, GHCR, or a private OCI registry (read-only) |
Custom
| Tool | Description |
|---|---|
| HTTP | A custom REST endpoint. You define the request shape (URL, method, headers, body, JSON schema) and the agent can call it as a named tool |
| MCP | Any Model Context Protocol server that supports streamable HTTP. The agent can call every tool the server exposes, and Plural authenticates with static headers or OAuth client credentials |
Creating a tool
From Workbenches → Integrations, click the card for the tool type you want to add.
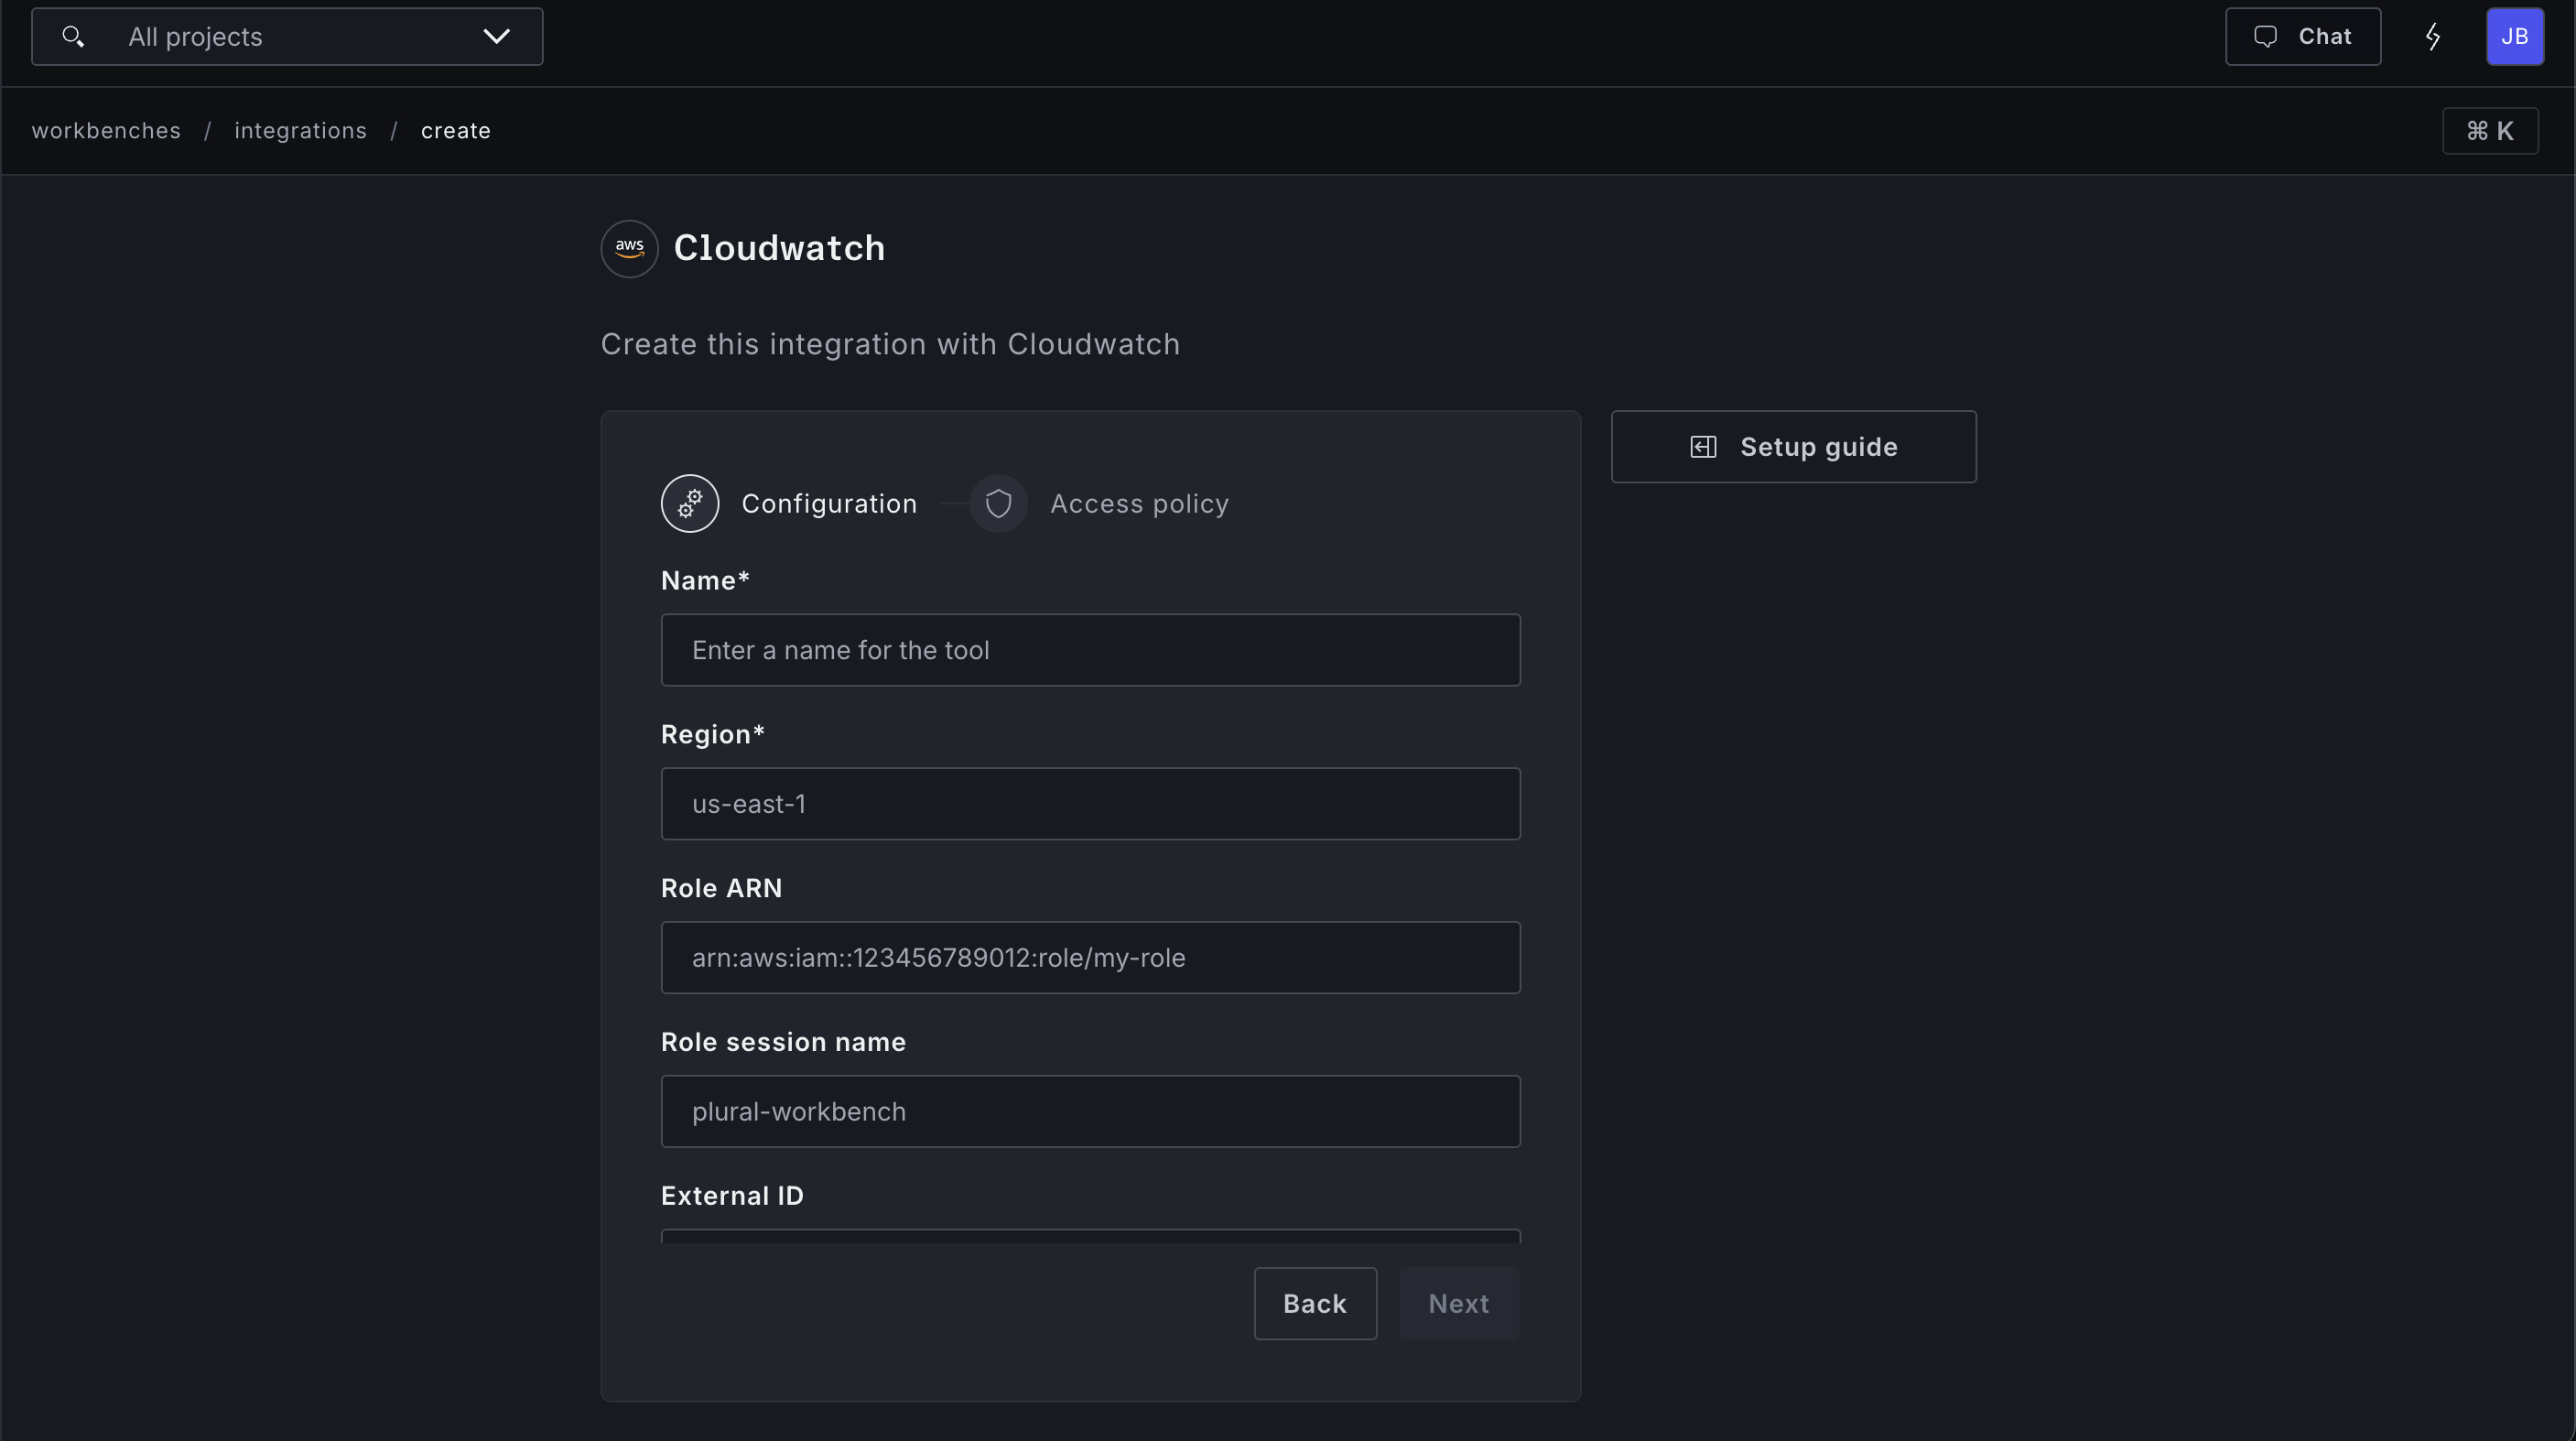
Each tool type has a setup form for its required credentials (API keys, endpoint URLs, tokens, etc.). For many tool types, Plural includes an inline setup guide in the form that walks you through where to find the credentials and what permissions to grant — look for the guide link next to the relevant fields.
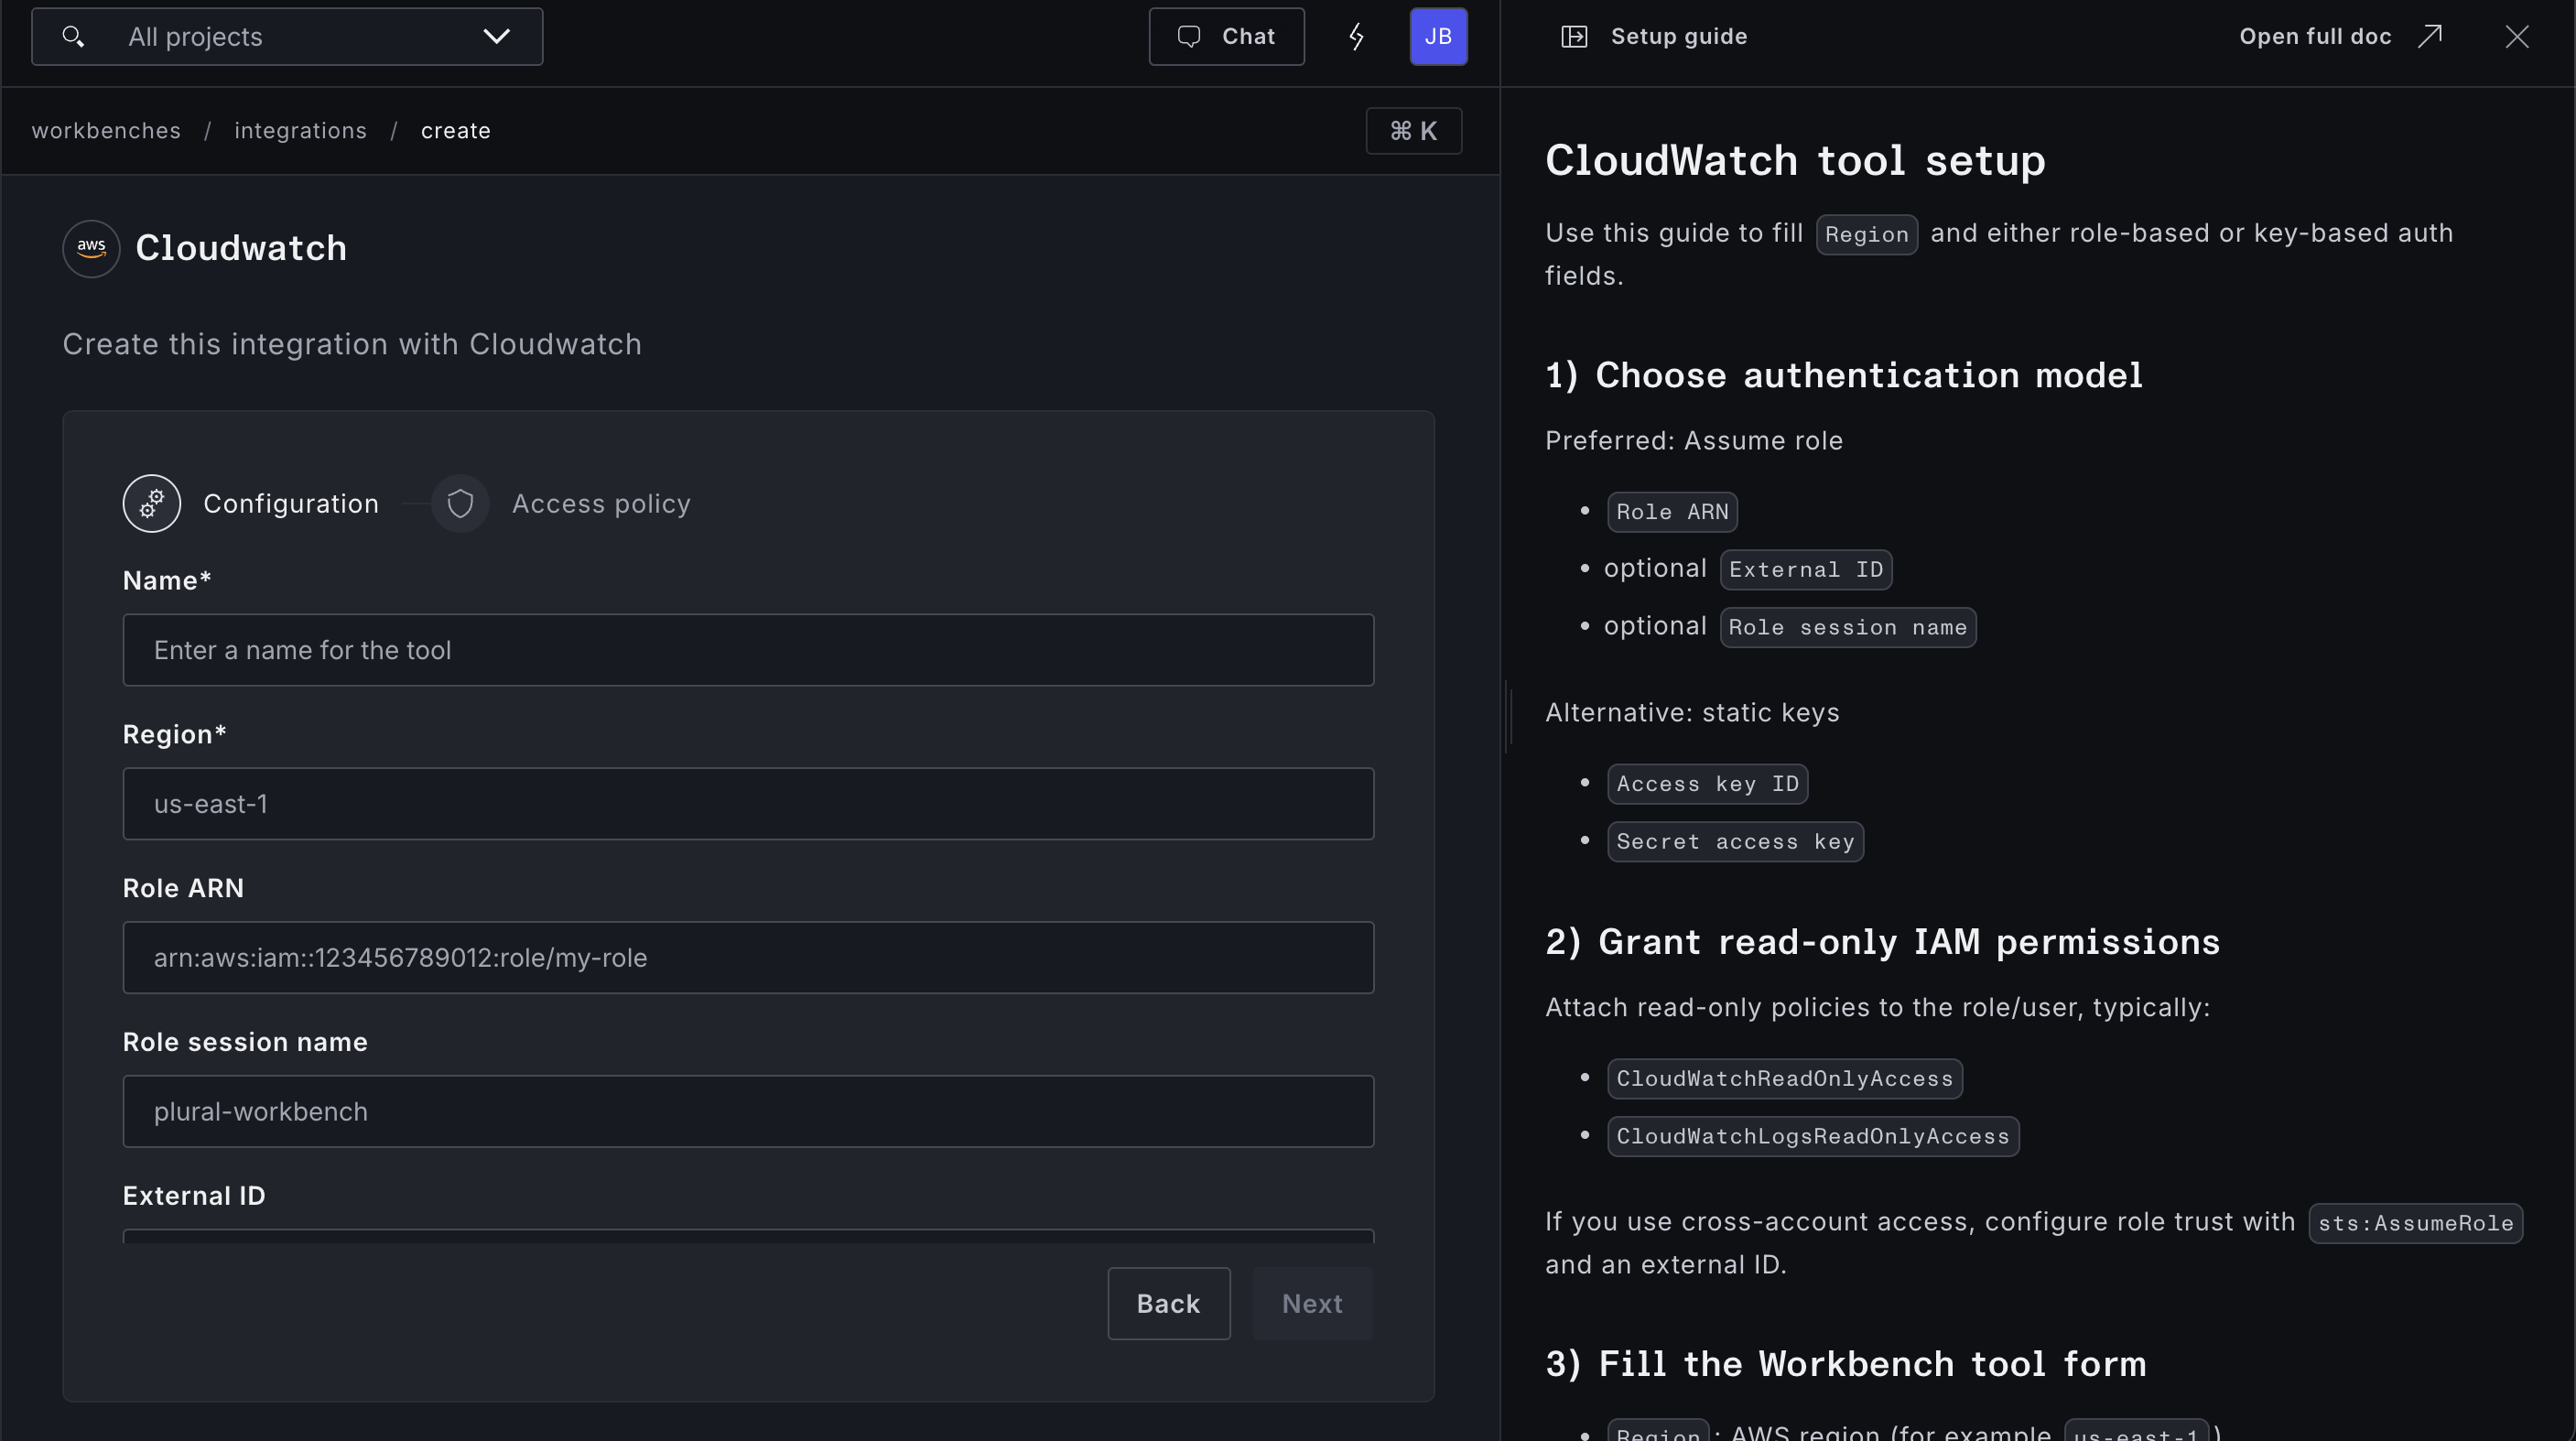
Once saved, the tool appears in Workbenches → Configured tools and can be attached to any workbench.
Attaching tools to a workbench
Tools are attached to workbenches during creation (Step 5) or via Edit on an existing workbench. A workbench can only call the tools explicitly attached to it — this gives you fine-grained control over what each agent can reach.
Tool policies
Tools are governed in two layers: who can attach and edit the tool, and what the agent is allowed to do when it calls the tool during a job.
Access policy
Each tool has its own read and write bindings:
- Read permissions control who can see the tool and attach it to a workbench
- Write permissions control who can modify the tool configuration and access policy
Users or groups without at least read access cannot attach the tool to their workbenches. This is particularly useful for restricting production cloud connections or sensitive API credentials.
Configure bindings by opening a tool in Workbenches → Configured tools and clicking Edit. If both lists are empty, access falls through to the parent project's policy.
Built-in tools also enforce authorization against the resource they access at execution time. For example, Kubernetes tools federate the user running the job to the target cluster using their Console email and groups. The Kubernetes API server then applies that identity's native RBAC rules to each request. Attaching or enabling a built-in tool therefore does not give the agent broader access than the user already has.
Workbench policies
Workbench policies evaluate each matching tool call the agent makes. They extend tool access bindings with Rego rules that can:
- Deny a call based on the actor, tool name, and arguments — for example, blocking deletes in
kube-system - Automatically approve a call that would otherwise wait for human approval
A policy cannot make an unavailable tool accessible or grant permissions the actor does not already have. Attach a policy to a workbench (optionally scoped to selected tool names) from Security → Policies, or use a binding policy to attach it automatically. See Workbench policies for the input schema, decision model, and examples, and Simulating and testing policies to inspect real tool-call inputs before writing rules.