Datadog
Connect Datadog to a workbench and query metrics, logs, and traces
Use the Datadog integration to give a workbench read-only access to the metrics, logs, and traces already stored in your Datadog account. After you configure the connection once, you can attach it to one or more workbenches and investigate Datadog data with natural-language prompts.
This guide uses the Plural Console UI. For the complete list of integrations and general tool behavior, see Workbench tools.
Prerequisites
Before you begin, make sure you have:
- A Datadog account that is already receiving the metrics, logs, or traces you want the workbench to query. This integration does not require a Datadog Agent; Plural queries your Datadog account through the Datadog API.
- Permission in Plural Console to create a configured tool and edit the target workbench.
- The hostname for your Datadog site, such as
datadoghq.com. Enter only the hostname, withouthttps://. - A Datadog API key and application key. Use dedicated, read-only credentials where possible.
- An existing workbench, or permission to create one. See Setting up a workbench.
Create credentials in Datadog
Create the organization API key:
- Open your account menu in Datadog and select Organization Settings.
- Select API Keys, then click New Key.
- Enter a descriptive name, create the key, and copy its value.
For the application key, a service account is recommended because its credentials are not tied to an individual user's lifecycle:
- Go to Organization Settings → Accounts → Service Accounts.
- Click New Service Account, enter its details, and assign it a role with the permissions described below.
- Create the account, select it from the service account list, and click New Key.
- Name the application key, click Create Key, and copy its value immediately. A service-account application key is displayed only once.
As an alternative, go to Organization Settings → Application Keys → New Key to create a user-owned application key. This key inherits its owner's permissions and is revoked if that user is disabled, so use this option only when tying the integration to an individual account is acceptable.
Datadog permissions
An application key uses the permissions of the Datadog user or service account that owns it. Assign that identity a Datadog role with only the permissions needed for the capabilities you plan to enable:
| Capability | Required Datadog permissions | What the workbench can query |
|---|---|---|
| Metrics | timeseries_query, metrics_read | Metric timeseries, recently active metric names, and indexed metric tags |
| Logs | logs_read_data, logs_read_index_data | Log events from the indexes granted to the application key owner |
| Traces | apm_read | APM spans |
For all three capabilities, grant all five permissions. Scope logs_read_index_data to every log index the workbench needs to query. See the Datadog documentation for Log Management permissions, metric timeseries, metric search, logs, and spans.
Create the Datadog tool
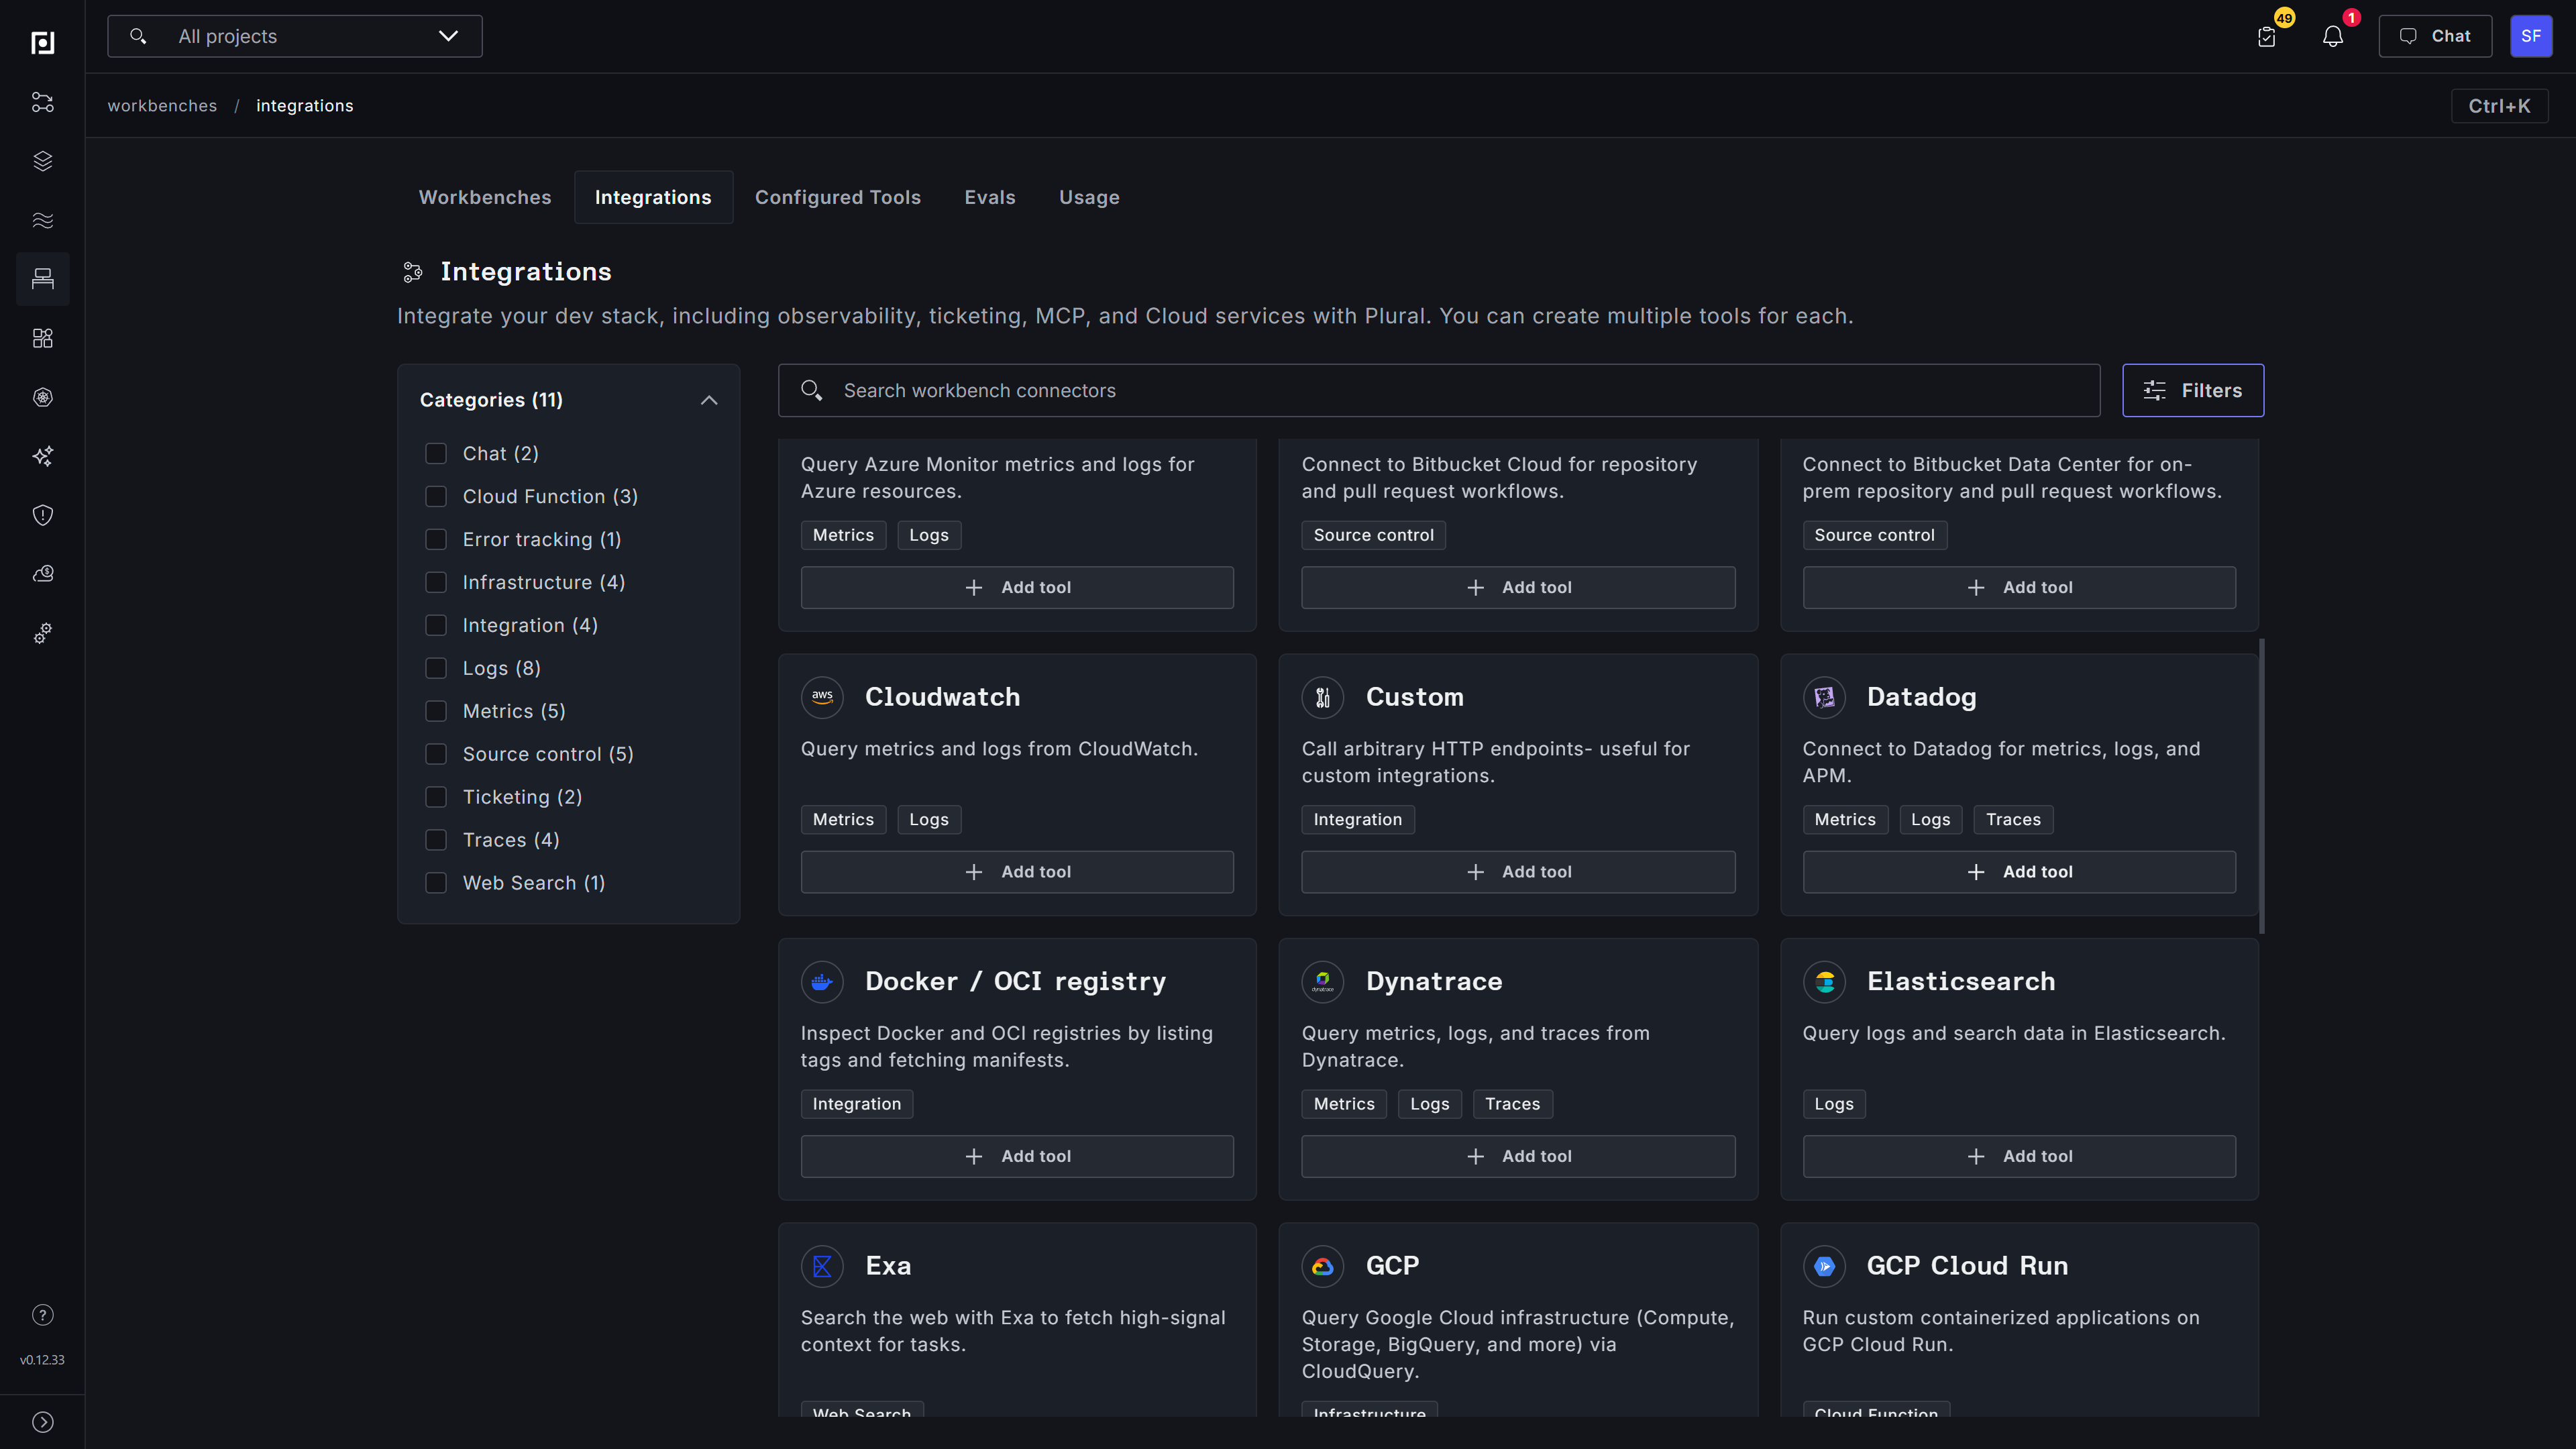
- In Plural Console, open Workbenches → Integrations.
- Find the Datadog card and click Add tool.
Configure the connection
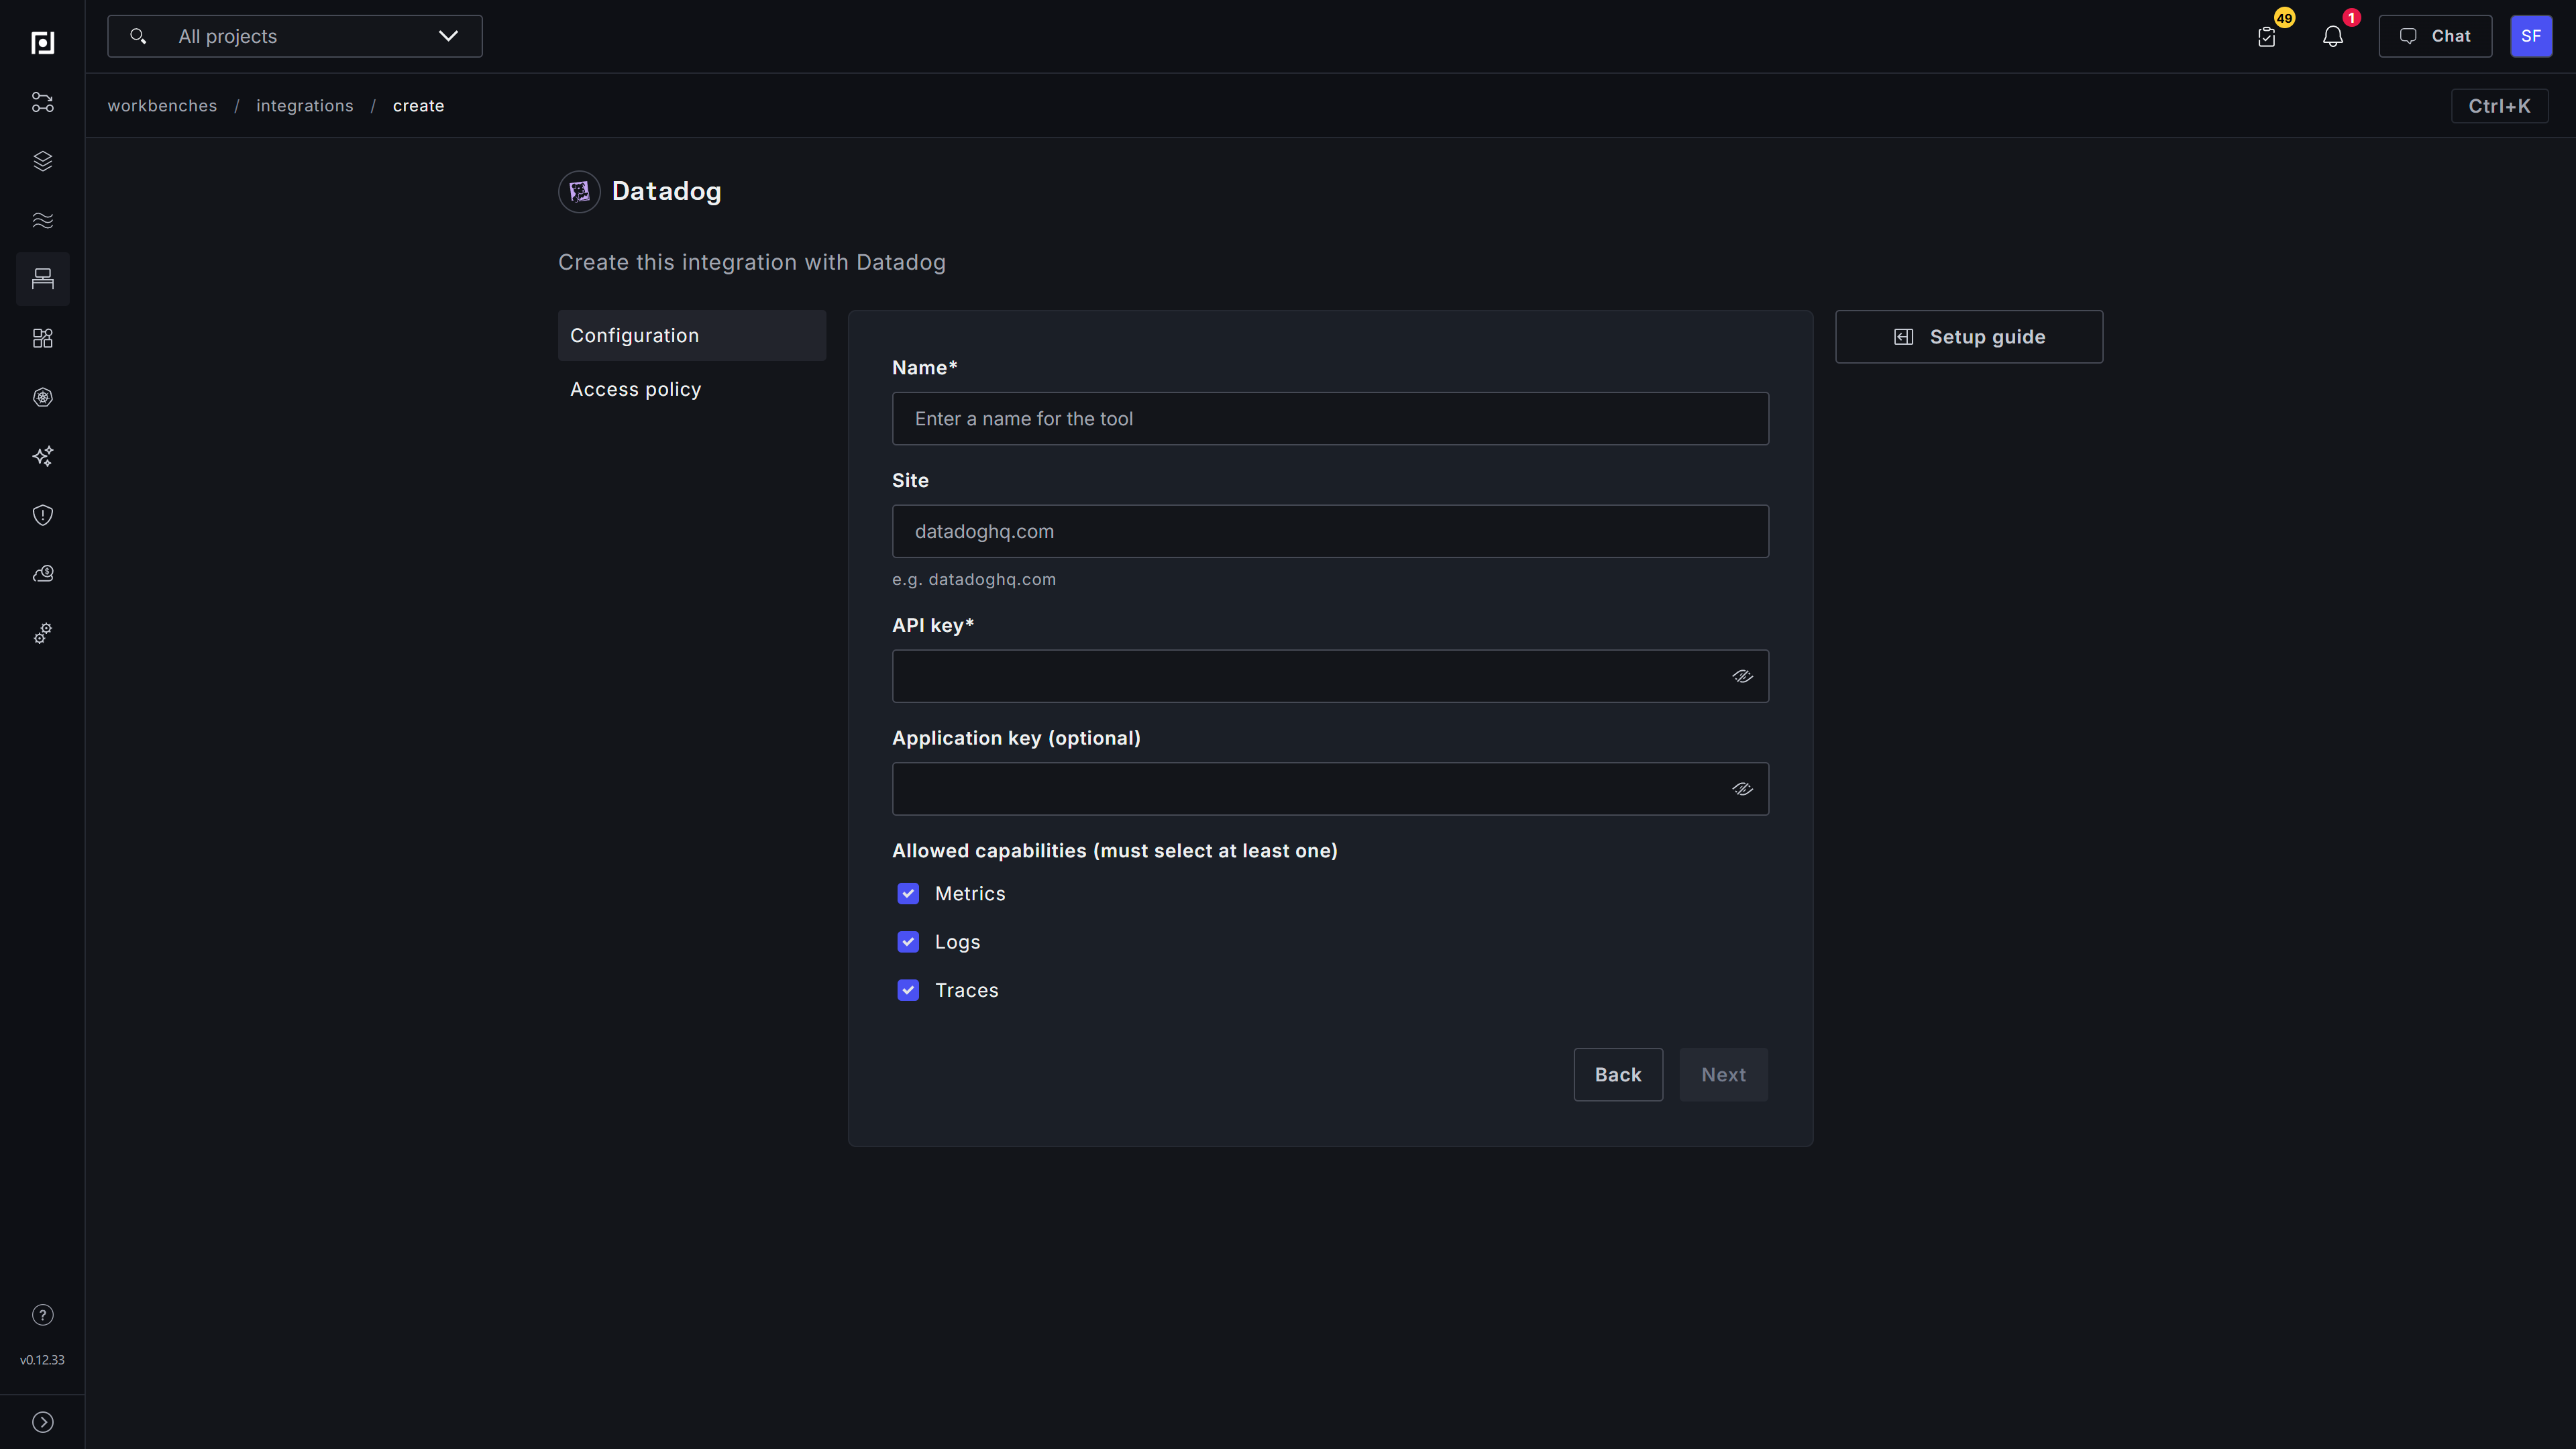
On the Configuration step, enter:
- Name — a recognizable name for the connection, such as
datadog-production. - Site — your Datadog site hostname, without a URL scheme.
- API key — the Datadog API key.
- Application key — the Datadog application key whose owner has the required permissions.
Under Allowed capabilities, select one or more of Metrics, Logs, and Traces. All three are selected by default. Enable only the capabilities that the application key is authorized to use and that the target workbenches need.
Click Next.
Configure access
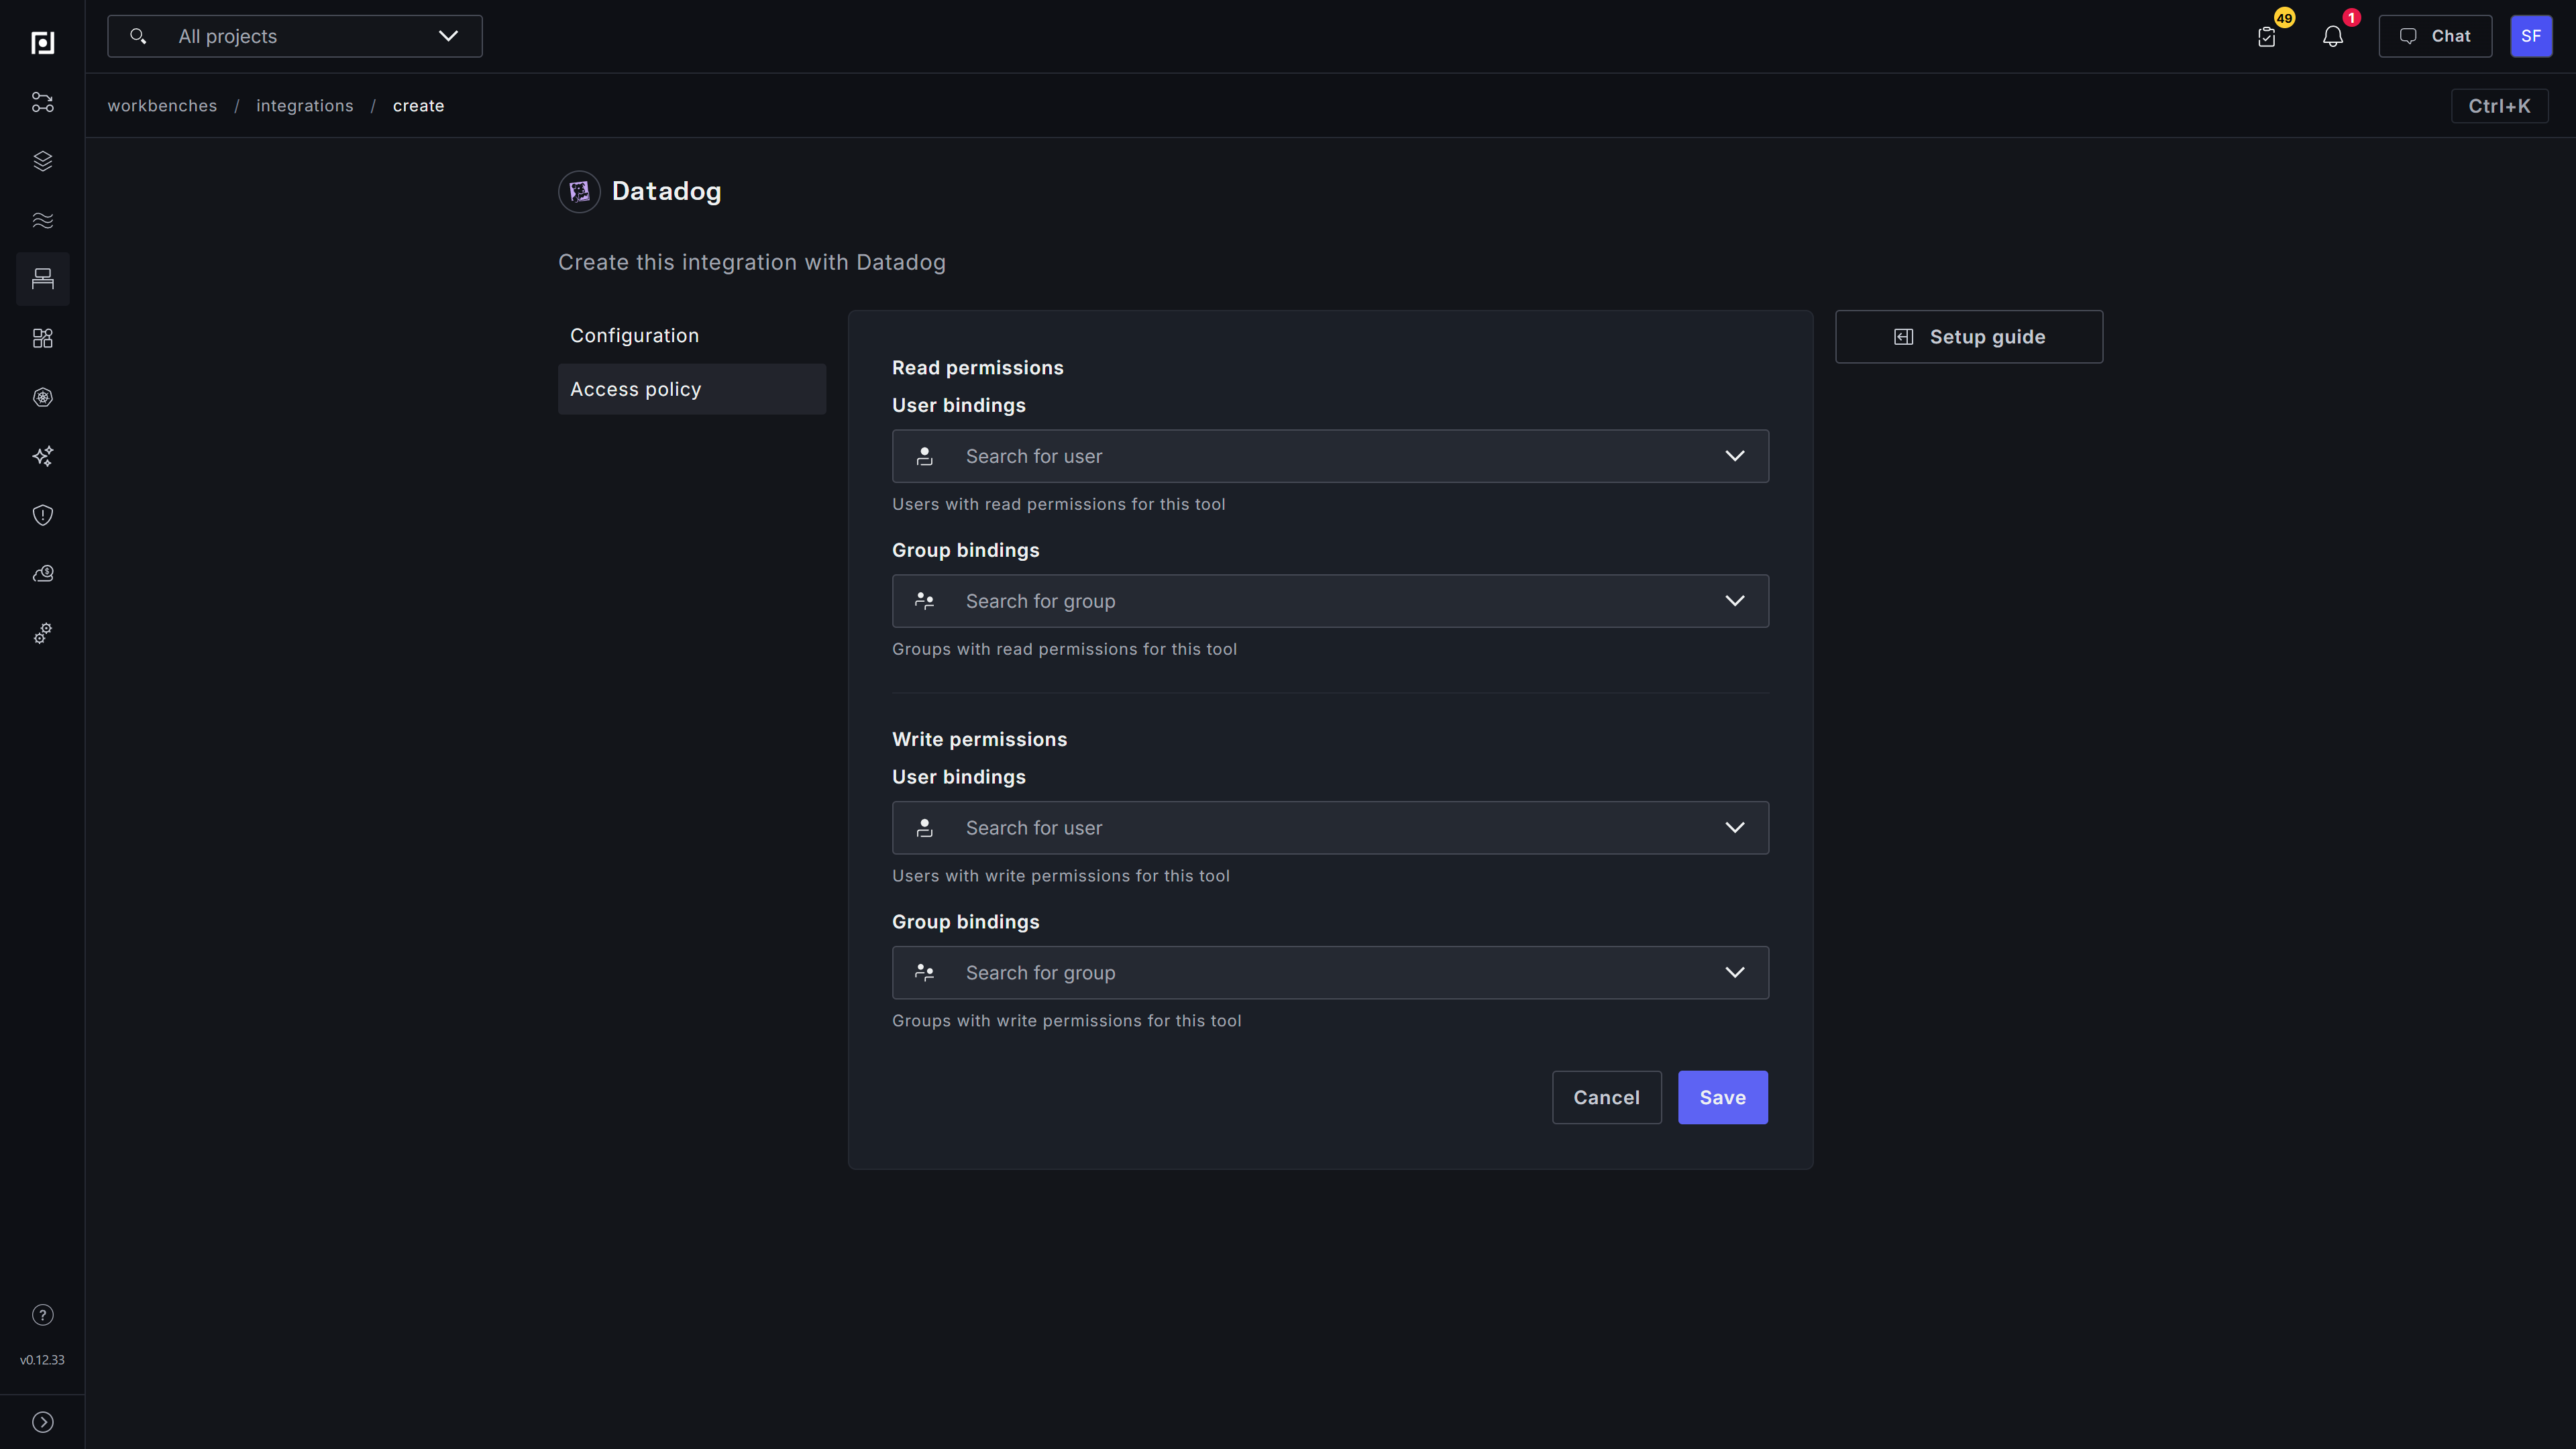
On the Access policy step, add the users or groups that should have read or write access to this configured tool:
- Read permissions control who can access and attach the tool to a workbench.
- Write permissions control who can modify the tool configuration and access policy.
Click Save. After the creation confirmation appears, the connection is available under Workbenches → Configured Tools.
Attach Datadog to a workbench
You can attach the tool while creating a workbench or add it to an existing one.
New workbench
On the final Attach tools step of the workbench wizard:
- Click Add tools.
- Select the Datadog connection by its configured name.
- Confirm that the capability chips you enabled during configuration appear on the selected tool.
- Complete the wizard by clicking Create workbench.
Existing workbench
- Open the workbench.
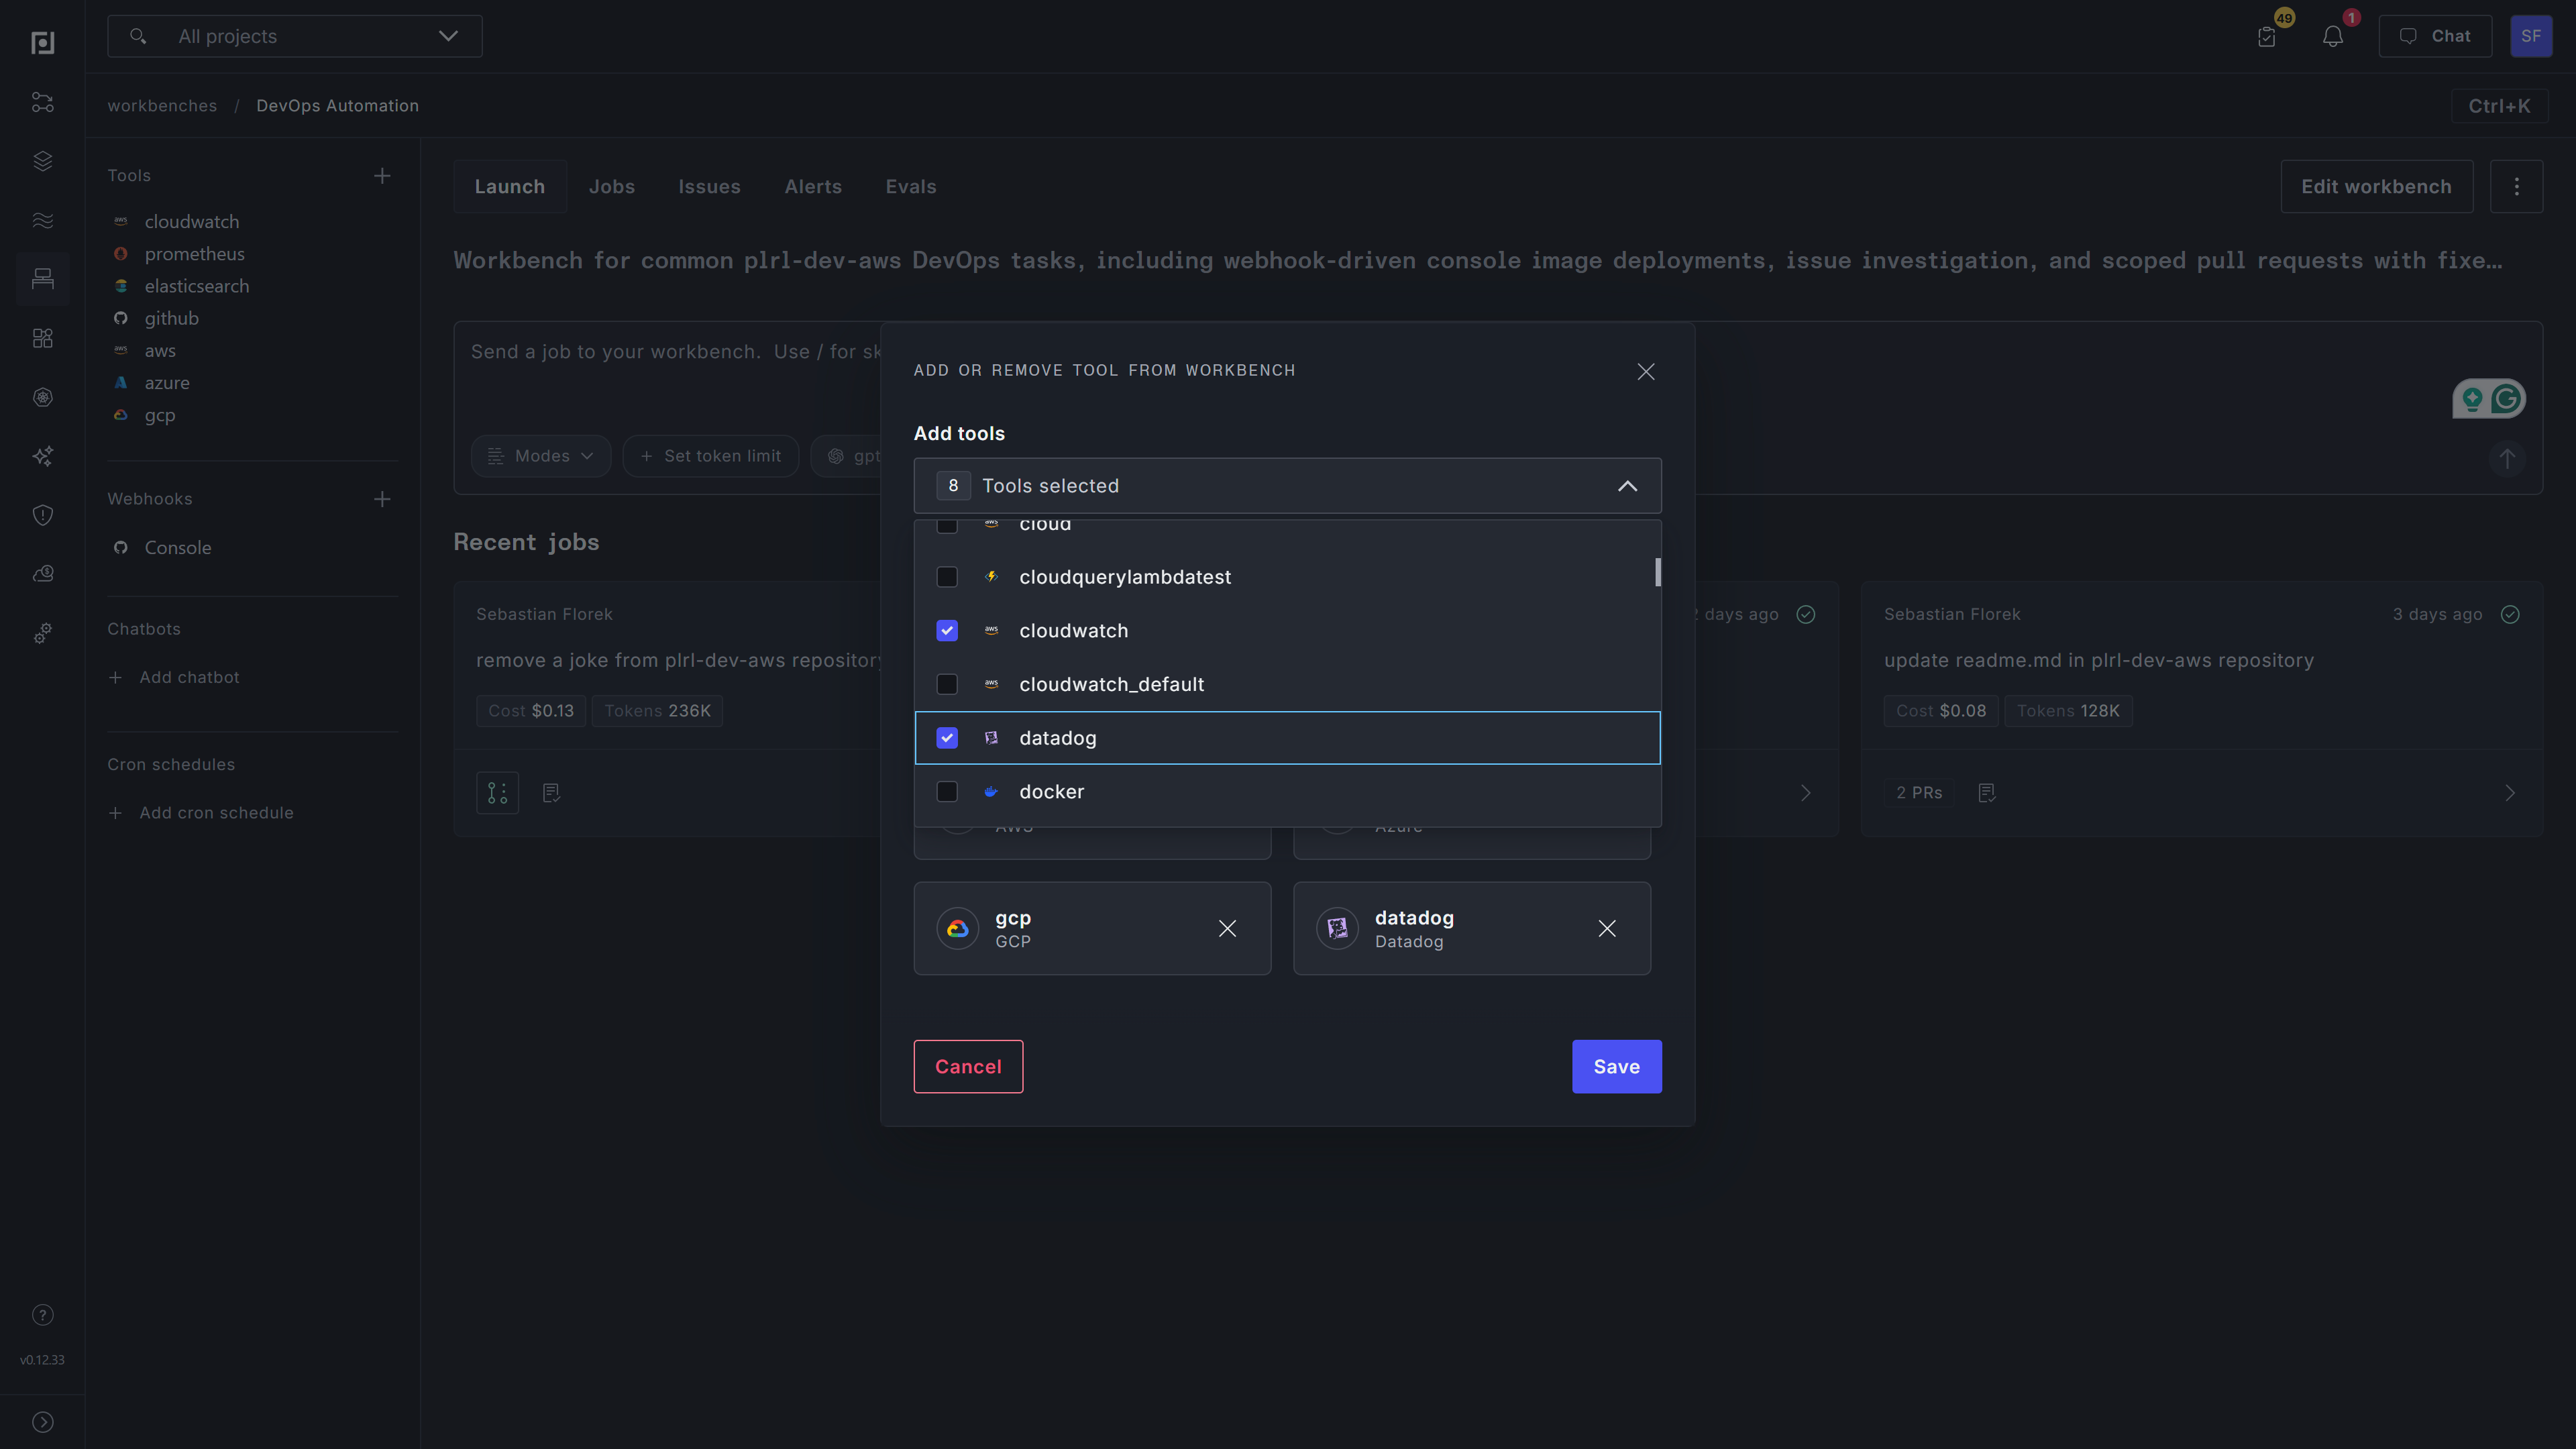
- In the left sidebar, find Tools and click Add tools. You can also open the overflow menu and select Tools.
- In Add or remove tool from workbench, select the Datadog connection.
- Click Save.
The configured Datadog tool now appears in the workbench's Tools section.
Query Datadog from a workbench
Open the workbench's Launch tab and describe the investigation in the prompt box. The Jobs tab contains run history rather than the new-job prompt. Include the signal, relevant service or environment tags, a time range, and the result you want. The workbench chooses the appropriate Datadog operation; there is no separate Datadog query builder in Console.
Try prompts such as:
- Metrics:
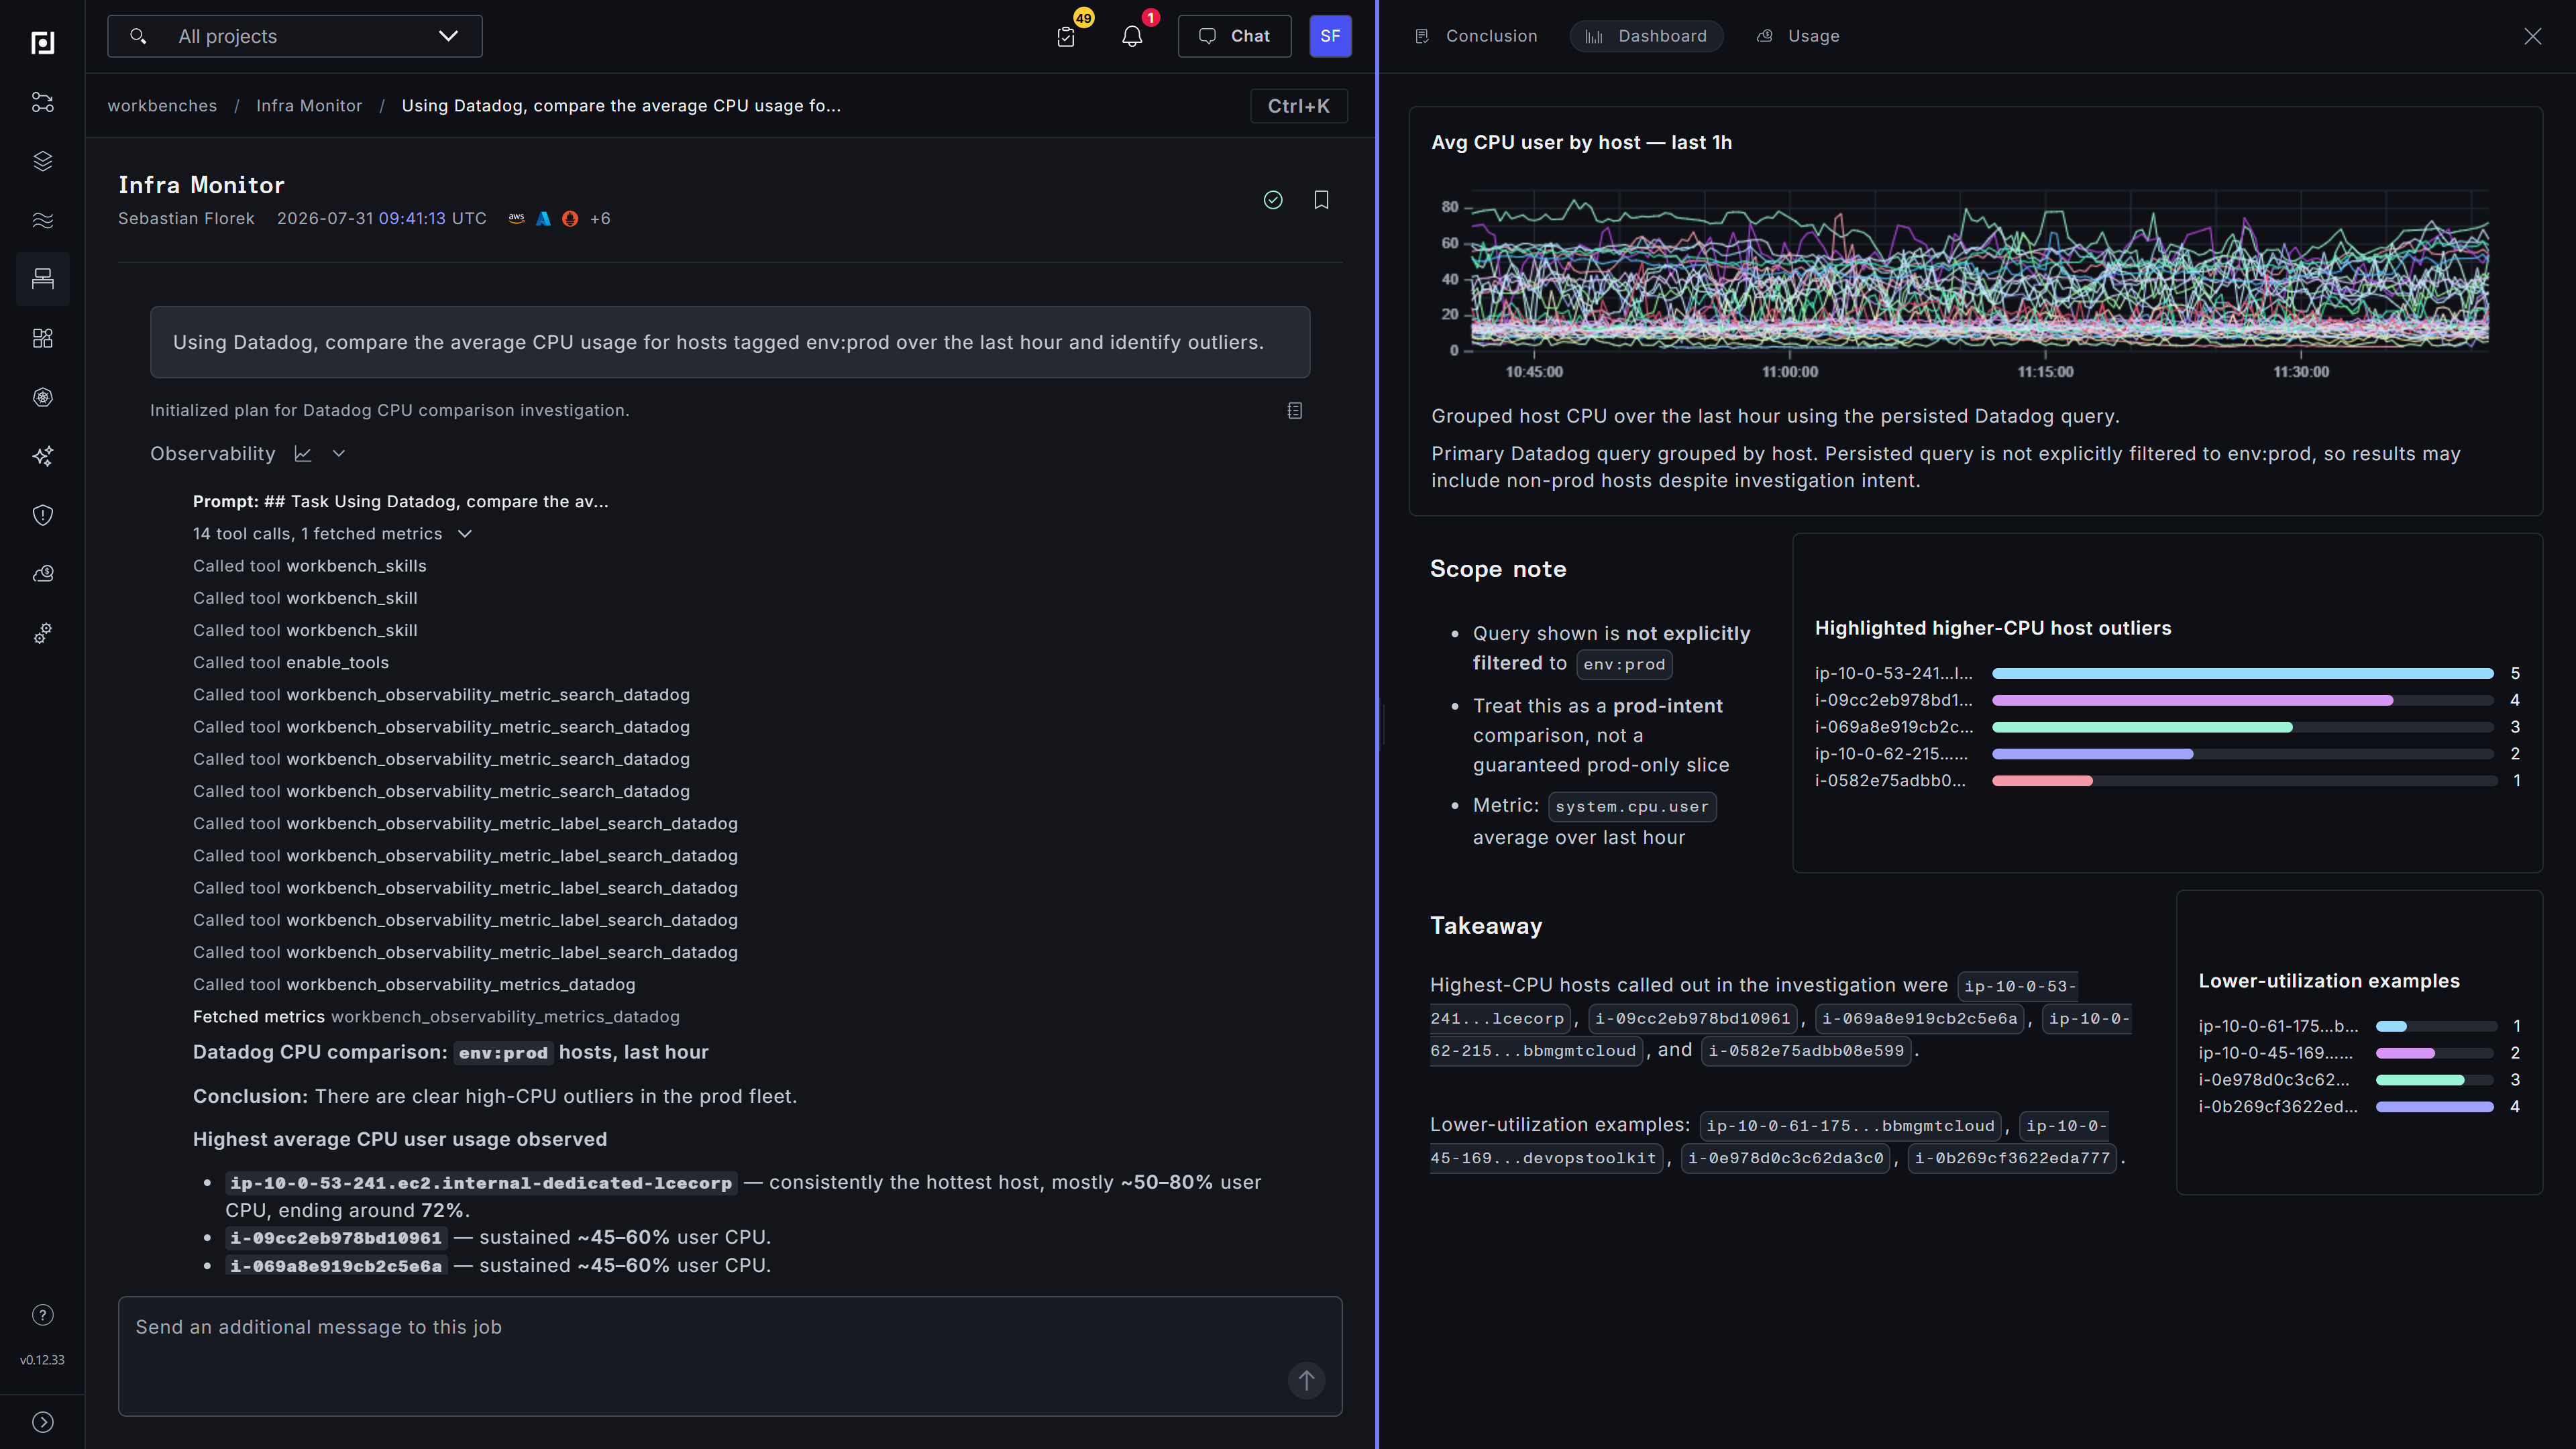
Using Datadog, compare the average CPU usage for hosts tagged env:prod over the last hour and identify outliers. - Logs:
Search Datadog logs for errors from service:checkout in env:prod during the last 30 minutes. Group the findings by status and summarize the most common messages. - Traces:
Find error spans for service:checkout in Datadog during the last 30 minutes. Identify the slowest resources and summarize any shared tags. - Correlated investigation:
Investigate the checkout latency increase over the last hour using Datadog metrics, logs, and traces. Build a timeline and cite the signals that support your conclusion.
Use Datadog metric and tag syntax when you need precise filtering. For example, include avg:system.cpu.user{env:prod} by {host} directly in a metrics prompt, or service:checkout status:error in a log or trace prompt.
Submit the job and watch its activity stream. To verify the integration, confirm that the job completes, open its Datadog tool activity, and check that the call succeeded and returned data for the requested signal. A tool activity entry can also contain an API error, so its presence alone does not verify the connection. For more about job output, see Running workbench jobs.
Query behavior and limits
The Datadog tool is read-only. It cannot create or modify dashboards, monitors, logs, metrics, or traces.
Keep these query behaviors in mind:
- Specify a time range, especially for trace prompts. Metrics and logs default to a recent 30-minute window when no range is supplied, but explicit ranges produce more predictable results.
- Metrics queries must cover less than seven days.
- Metric-name and tag discovery covers recently indexed data and is not an exhaustive historical catalog.
- Log and trace searches return one page of results. Use narrow filters, time ranges, and limits for reliable investigations.
- Trace results are individual spans, not reconstructed trace trees.
Troubleshooting
Authentication or permission errors
- Confirm that both the API key and application key are configured and belong to the same Datadog organization.
- For a
403response, verify that the application key owner has the permissions required for every enabled capability. - If only log queries fail or omit expected indexes, grant the application key owner both
logs_read_dataandlogs_read_index_data, and confirm that the index-level permission covers the required indexes. - Confirm that Site matches the Datadog account. Enter the hostname only, not a full URL.
- To rotate a key, open Workbenches → Configured Tools, select Edit configuration, and enter the replacement secret. Existing secret values are never displayed.
No data is returned
- Verify in Datadog that the expected data exists for the same query and time range.
- Include an explicit time range and check service, environment, host, and tag filters for spelling or scope mismatches.
- Confirm that the required capability is enabled on the configured tool and that the tool is attached to the workbench.
- Remember that enabling Logs or Traces makes those query operations available; it does not configure log or trace ingestion into Datadog.
A query fails or returns incomplete results
- Open the failed Datadog activity in the job and inspect the API error before retrying.
- Check metric, log, or span filters against the corresponding Datadog query syntax. Start with a narrow, known-good query and add filters incrementally.
- Keep metrics ranges under seven days. For logs and traces, reduce the time range or add filters if the first page does not contain enough relevant results.
- If Datadog reports a rate limit, wait for the limit to reset and retry with a narrower query. Avoid repeatedly launching broad trace searches.
The Datadog tool is unavailable
- Confirm that the tool appears under Workbenches → Configured Tools.
- Verify that your user or group has read access to the configured tool.
- Reopen the workbench's Tools dialog and confirm that the Datadog connection is selected.